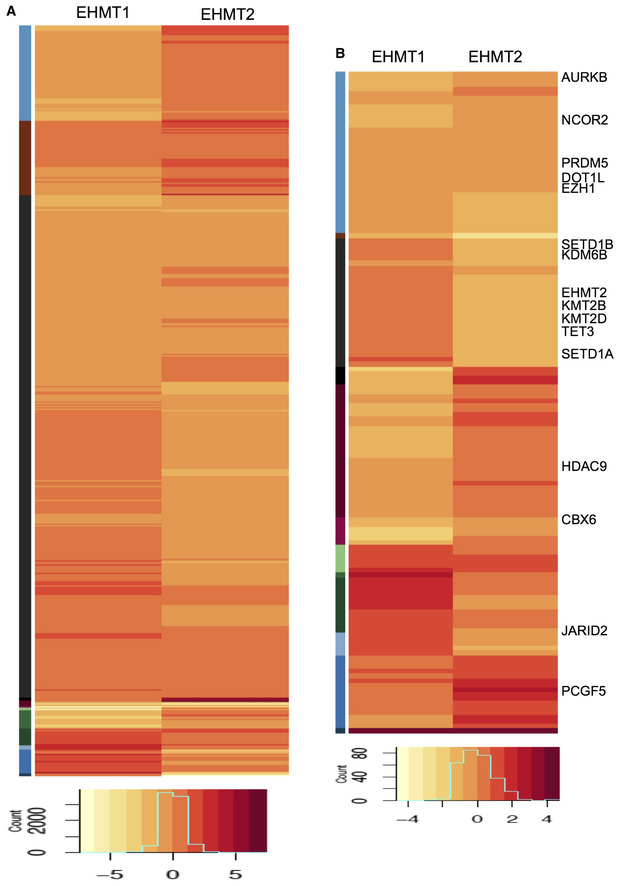
Figure EV5. Transcriptome analysis of EHMT depleted cells.

-
A, BHeat map for differential expression of (A) all genes and (B) chromatin modifiers obtained from RNA‐Seq analysis of shEHMT1 or shEHMT2 compared to shCnt transduced HDFs. Representative genes that were altered similarly or distinctly in EHMT1 versus EHMT2 are indicated from few clusters.
