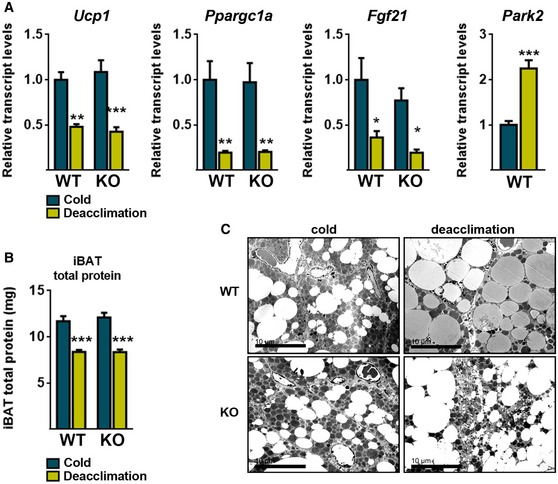
Figure EV2. Effects of 21‐day cold (4°C) and subsequent deacclimation at thermoneutrality (29°C) for 24 h on iBAT in Parkin‐KO and wild‐type mice.

- Relative transcript levels of thermogenesis‐related genes and Park2 (n = 6; WT) (n = 8; Parkin‐KO). Data are presented as means ± s.e.m. *P < 0.05, **P < 0.01, ***P < 0.001. ANOVA with Tukey's post hoc test.
- Total protein content in iBAT (n = 6; WT) (n = 8; Parkin‐KO). Data are presented as means ± s.e.m. ***P < 0.001. ANOVA with Tukey's post hoc test.
- Representative electron microscopic images of iBAT (scale bars, 10 μm).
