
Figure 5. Deacclimation to cold induces Parkin expression and autophagic degradation of mitochondria.
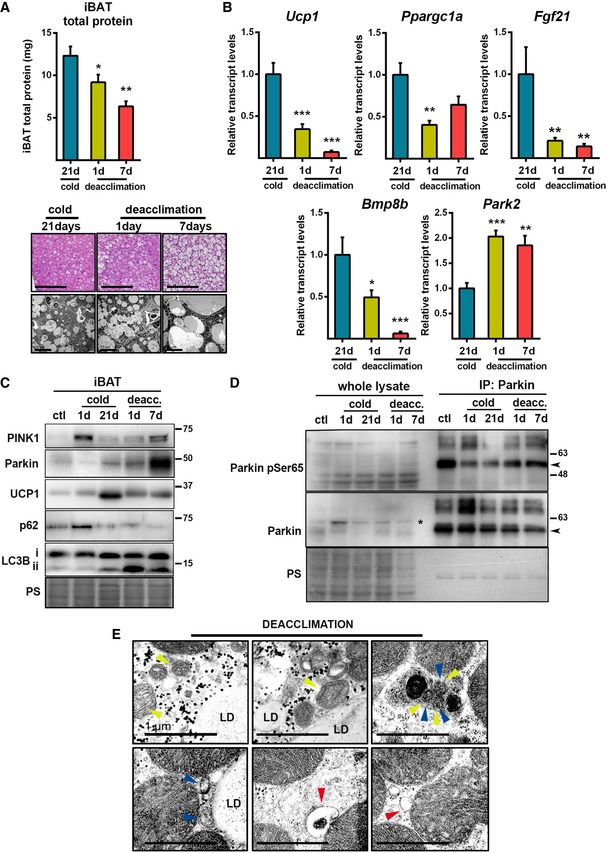
WT mice were acclimated to cold for 21 days (21 d, 4°C) and then deacclimated at thermoneutrality (29°C) for 1 day (1 d) or 7 days (7 d).
- Top: Total protein content in iBAT during cold deacclimation (n = 6). Data are presented as means ± s.e.m. *P < 0.05, **P < 0.01 compared to 21 d. ANOVA with Dunnett's post hoc test. Bottom: Representative optical microscopic images of H&E‐stained iBAT (scale bars, 100 μm) and electron microscopic images of iBAT (scale bars, 10 μm).
- Relative transcript levels of thermogenesis‐related genes and Park2 in iBAT (n = 6). Data are presented as means ± s.e.m. *P < 0.05, **P < 0.01, ***P <0.001 compared to 21 d. ANOVA with Dunnett's post hoc test.
- Representative immunoblot of the indicated thermogenic and autophagic proteins in iBAT during cold acclimation and deacclimation. PS: Ponceau staining.
- Representative immunoblot of Parkin phosphoSer65 and total Parkin in whole lysates of iBAT and after Parkin immunoprecipitation. Arrowheads indicate Parkin 52 kDa band, and asterisk indicates a non‐specific band.
- Representative electron microscopic images of autophagic and mitophagic events in iBAT after 1 day of cold deacclimation. Yellow arrowheads indicate mitochondrial cristae, blue arrowheads indicate double‐membrane autophagosomes, and red arrowheads indicate structures compatible with mitochondria‐derived vesicles. LD: lipid droplet. Scale bars, 1 μm.