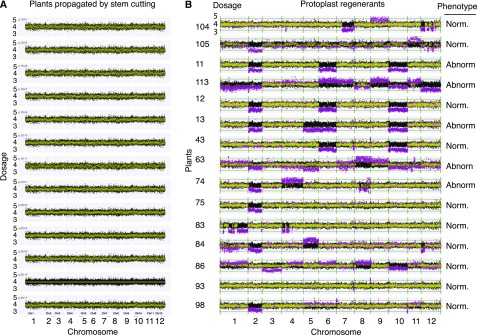
Figure 3.
Frequent genome dosage changes in plants regenerated from protoplasts. Each horizontal track represents genomic dosage values of one individual. Dosage on y axis is plotted versus 250-kb chromosomal bins on the x axis, arrayed consecutively for the 12 chromosomes of potato. To provide the range variation expected from normal (Norm) genomes, the control dataset of 8 propagated plants is plotted in black for each plot track. Individual sample data points are yellow if not statistically different from controls and magenta if they display significant divergence according to the Z-score statistics with 5% false discovery rate. Four genomic copies are expected from autotetraploidy. Bins with high variability were dropped (see “Materials and Methods”). A, Dosage plots from controls consist of 8 plants propagated using stem cuttings. Five controls were sampled twice, and each preparation is plotted independently. The next to last control plant (p.2D-10) was used for standardization of all others read counts. B, Dosage plots for 15 individuals regenerated from protoplasts. Two to four independent samples are plotted together for each plant, except for plant 105 (See Supplemental Fig. S1 for separate plots of all biological replicates). Because calli could be resampled, it is possible that some plants may derive from the same protoplast. Abnorm, abnormal.

