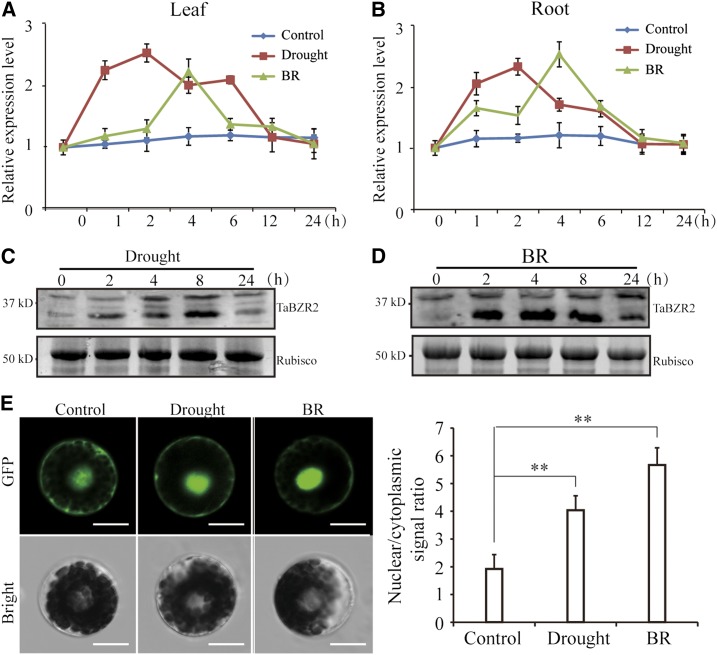
Figure 1.
Expression and localization of TaBZR2 in wheat under BR and drought conditions. A and B, The expression profile of TaBZR2 in 2-week–old wheat seedling leaf and root tissue under drought and BR treatments for the indicated time. Transcript levels were quantified by RT-qPCR assays. The expression of β-actin was analyzed as internal control. Each data point is the mean (±se) of three experiments. C and D, Protein level of TaBZR2 in 2-week–old wheat seedlings after drought and BR treatments for the indicated time. Total proteins were extracted and subjected to immunoblot analysis with anti-TaBZR2 antibodies. Rubisco was used as a loading control. E, Localization of TaBZR2 protein under drought and BR conditions. The nuclear/cytoplasmic signal ratio represents nuclear-accumulated TaBZR2 versus cytoplasmic-accumulated TaBZR2. Images were observed under a laser scanning confocal microscope. Scale bar = 12 μm. Each data point is the mean (±se) of 10 biological replicates (**P < 0.01; Student’s t test).

