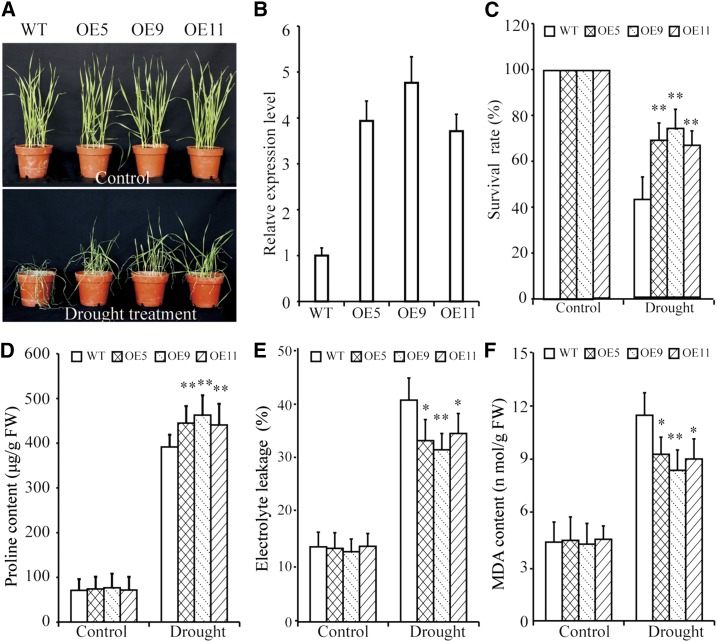
Figure 2.
TaBZR2-overexpressing wheat plants exhibit improved drought tolerance. A, Phenotypes of TaBZR2-overexpressing (OE5, OE9, and OE11) and wild-type wheat plants under well-watered and drought conditions. B, RT-qPCR analysis of TaBZR2 gene expression in TaBZR2-overexpressing and wild-type plants. The expression of β-actin was analyzed as an internal control. Each data point is the mean (±se) of three experiments. C, Survival rate of the control and water-stressed plants (without irrigation for 21 d). D, Pro content in seedlings under normal and drought conditions. E, Electrolyte leakage in seedlings under normal and drought conditions. F, MDA content in seedlings under normal and drought conditions. Each data point is the mean (±se) of three experiments (10 seedlings per experiment). The asterisks indicate significant differences between TaBZR2-overexpressing and wild-type wheat plants (Student’s t test, *P < 0.05 and **P < 0.01). WT, wild type.

