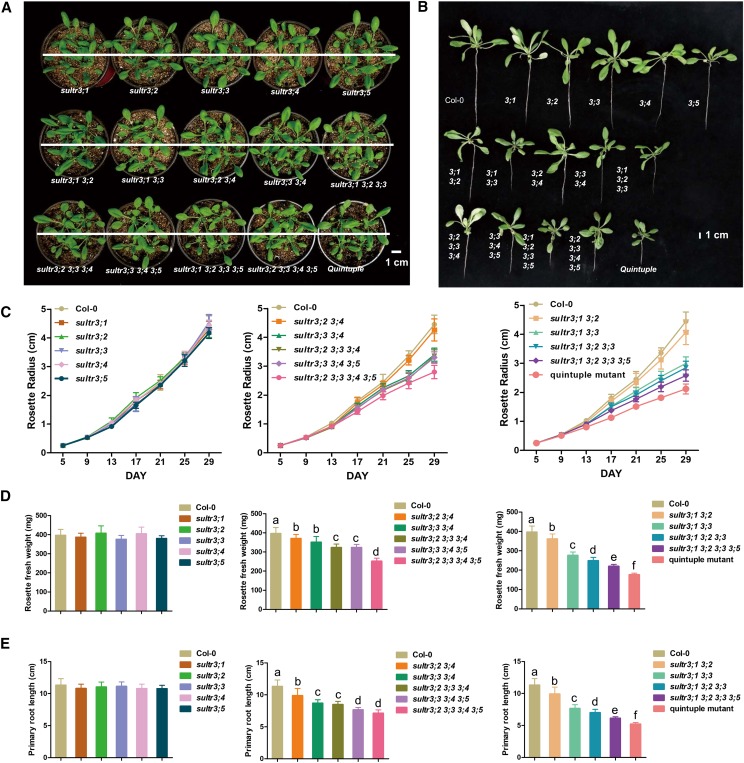
Figure 3.
Multigene defective mutants of SULTR3 show various degrees of growth retardation. A and B, Phenotype of aerial part (A) and whole plant (B) of SULTR3 knockout mutants and wild-type plants (Col-0). Plants were photographed 29 d after germination. Scale bars = 1 cm. C, Time-course change of rosette diameters. Values are means ± sd (n = 20 plants for each line). D, Fresh weight of rosette leaves. Values are means ± sd (n = 20 plants for each line). Letters indicate statistically significant differences between groups determined with one-way repeated measure ANOVA (P < 0.001). E, Length of primary roots. Values are means ± sd (n = 20 plants for each line). Letters indicate statistically significant differences between groups determined with one-way repeated measure ANOVA (P < 0.001).

