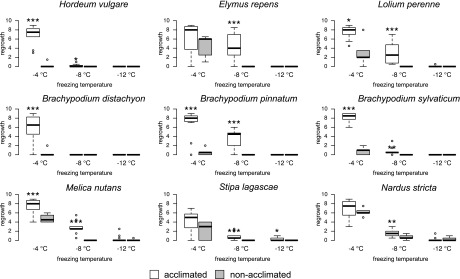
Figure 2.
Frost tolerance after cold acclimation. Box plot representation shows the regrowth of nine acclimated and nonacclimated Pooideae species after exposure to three freezing temperatures (−4°C, −8°C, and −12°C). Regrowth is scored on a scale from 0 to 9, where 0 is dead and 9 is undamaged. Significant differences in regrowth between acclimated and nonacclimated plants are indicated by asterisks (***, P ≤ 0.001; **, P ≤ 0.01; and *, P ≤ 0.05).

