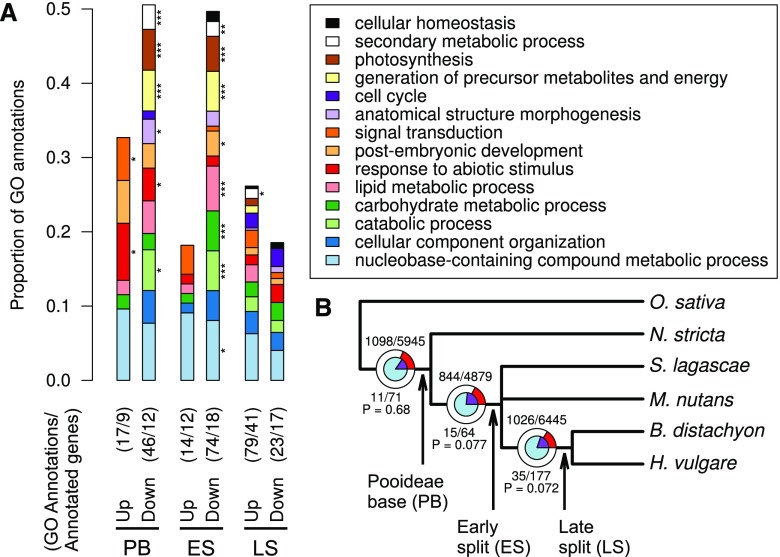
Figure 3.
GO enrichment and positive selection in branch-specific cold-responsive genes. A, GO enrichment analysis of HCOGs that were differentially expressed (DEGs) in all species (Pooideae base [PB]), only in species after N. stricta split off (early split [ES]), or only in B. distachyon and H. vulgare (late split [LS]). Significant differences are indicated by asterisks (*, P < 0.05; **, P < 0.01; and ***, P < 0.005, Fisher’s exact test). GO enrichments are shown for up- and down-regulated DEGs, not distinguishing between short- and long-term responses. Both the number of annotated genes and the number of annotations are indicated for each set of branch-specific DEGs. B, Positive selection at different stages in Pooideae evolution. The circles and numbers represent the HCOG gene trees that were tested for positive selection at each split. The inner blue circle and numbers below the branches represent HCOGs with branch-specific differential expression (i.e. genes that were cold responsive exclusively in the species under the respective branch), whereas the outer circles and numbers above the branches represent all other HCOGs. The purple and red pie-chart slices represent the proportions of HCOGs (first number) with positive selection (P < 0.05) among the total number of tested HCOGs (second number). The P values indicate the overrepresentation of positive selection among the branch-specific DEGs (hypergeometric test).

