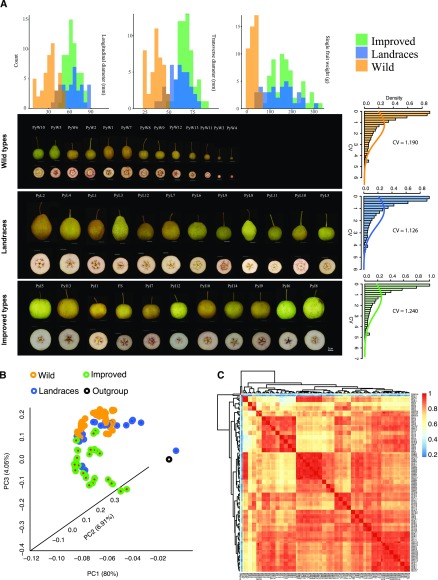
Figure 1.
The phenotype and expression pattern of all sequencing accessions. A, The phenotypic features of fruit and images of its transverse section with dyed stone cell from wild, landraces, and cultivated pear accessions. The fruits were digitally extracted for comparison. At top, the phenotypic distribution of longitudinal diameter, transverse diameter, and single fruit weight from three groups are presented. At right, the distribution of CV within each group is presented. B, The three-dimensional plot of PCA from all gene RPKMs of the 41 accessions. Orange points represent wild accessions; blue points represent landraces; green points represent improved accessions; black point represents the outgroup. C, The heatmap of PCCs from all 41 accessions. The color scale at the right represents PCC values. Red color represents the high correlation; blue represents the low correlation. The text on the right and bottom represent the sample names. Wild, wild type; PC, principal component.

