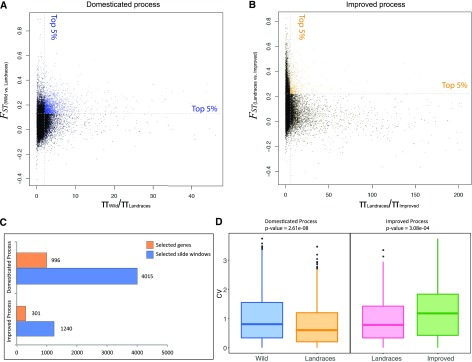
Figure 4.
The identification of selective sweeps during pear domestication and improvement. A, The identification of selective sweeps during pear domestication. Each point represents a 10-kb slide window. Blue points represent the candidate selective sweeps. The x axis indicates the πWild/πLandraces ratio; y axis indicates the FST value. B, the identification of selective sweeps during pear improvement. Each point represents a 10-kb slide window. Orange points represent the candidate selective sweeps. The x axis indicates the πLandraces/πImproved ratio; y axis indicates the FST value. C, The number of selected slide window and genes during domestication and improvement. Blue bar represents the selected slide window; orange bar represents selected genes. D, the CV for selected genes in the domesticated and improved process. Wild, wild type.

