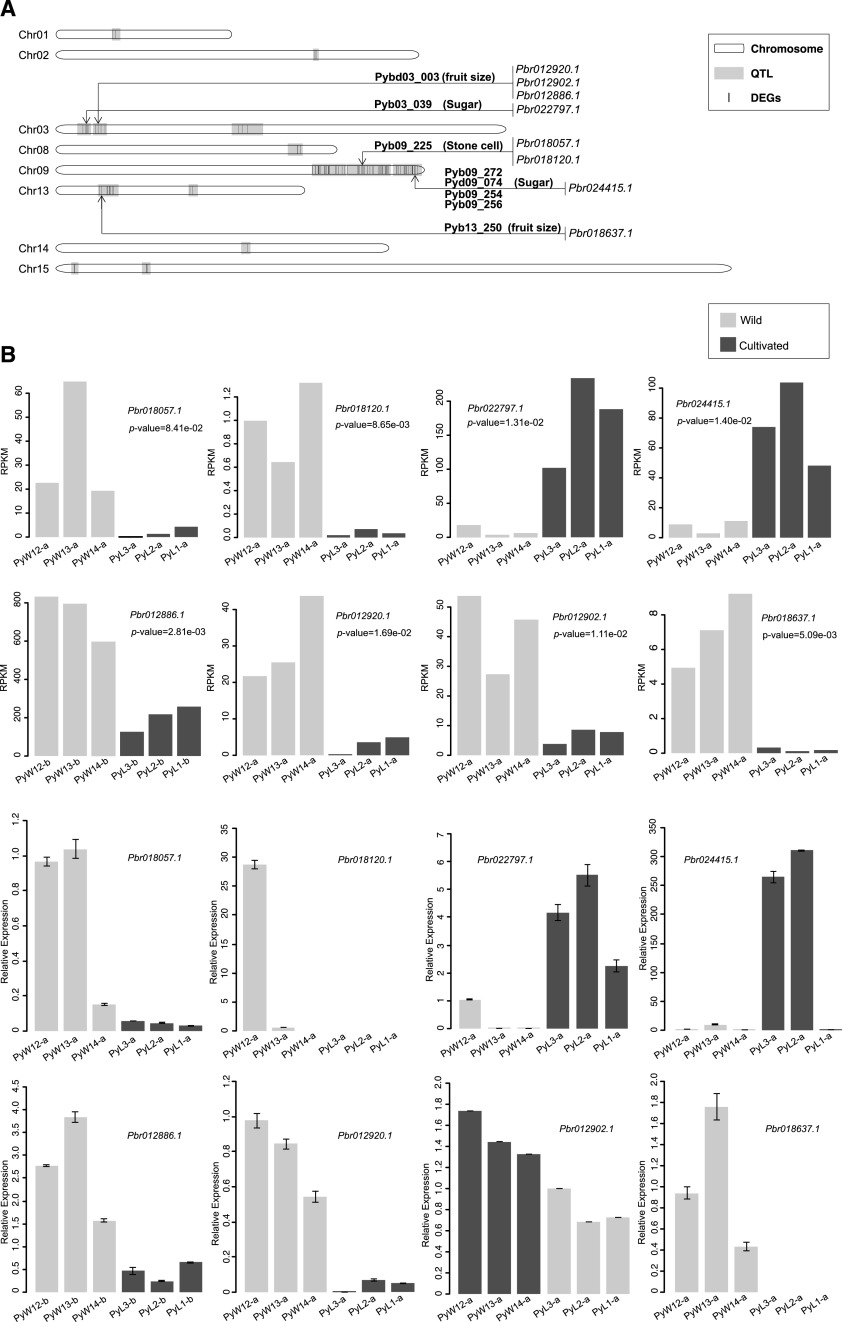
Figure 7.
Overlap mapping between DEGs and QTLs related to fruit traits in pear. A, The mapping of QTLs against DEGs. The light blue blocks indicate QTLs, and the inside black lines indicate DEGs. All chromosomes with QTLs are displayed. The arrows indicate the genes related to important traits; the text beside the horizontal line indicates the QTL name, and the text in the brackets indicates the trait controlled by that QTL. B, The expression levels of eight genes mapped to QTLs controlling stone cell content, sugar content, and fruit size between wild and cultivated pears at the small or enlarged fruit stage. The gray bar represents the wild pear accession, and the black bar represents the cultivated accession. Data shown are the means ± sd from three replications. Wild, wild type.

