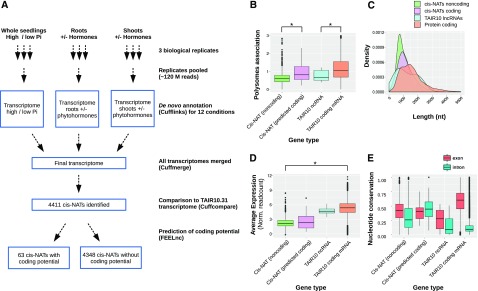
Figure 2.
Identification and characterization of cis-NATs. A, Schematic diagram of the pipeline used for de novo cis-NAT identification from the 12 different experimental conditions. B, Boxplot comparing polysome association of cis-NATs predicted to be noncoding (green) or coding (pink), non-coding RNA (ncRNA;cyan), and protein-coding genes (salmon) annotated in TAIR10 database. C and D, Plots comparing transcript length (C) and RNA steady-state level (average expression reported as normalised readcounts; D) of cis-NATs predicted to be noncoding (green) or coding (pink), ncRNA (cyan), and protein-coding genes (salmon) annotated in TAIR10 database. E, Boxplots comparing the nucleotide conservation across 20 angiosperm genomes within exonic and intronic regions of the four categories of transcripts listed above.

