Figure 3.
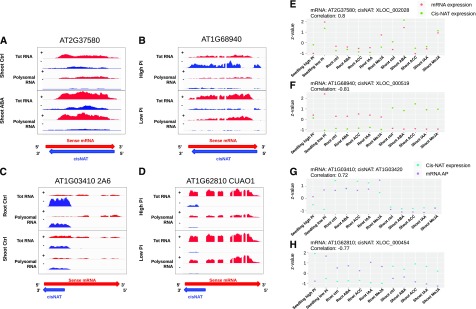
Correlations between expression of cis-NATs and changes in steady-state level or poylsome association of the cognate sense mRNA. A–D, Coverage plots showing the density of RNA-sequence (RNA-seq) reads per position at AT2G37580, AT1G68940, AT1G03410, and CuAO1 loci. The red and blue areas represent the density of reads mapping to the sense mRNA and cis-NATs, respectively. For each experimental condition, the top part corresponds to total RNA-seq reads and the bottom part to polysomal RNA-seq reads. The red and blue arrows at bottom indicate the cis-NAT-mRNA pair orientation. E–H, Correlation plots showing the steady-state level of the coding mRNA (red dots) and cis-NAT (green dots) for AT2G37580 and AT1G68940 loci (E and F, respectively) or the steady-state level of the cis-NAT (cyan dots) and the association with polysomes of the cognate sense mRNA (purple dots) for AT1G03410 and CuAO1 loci (G and H, respectively). The Z-score of normalized read counts calculated from the 12 experimental conditions is represented on the y axis. Pearson correlation coefficients between the two variables shown in each plot are indicated on top of the plots.

