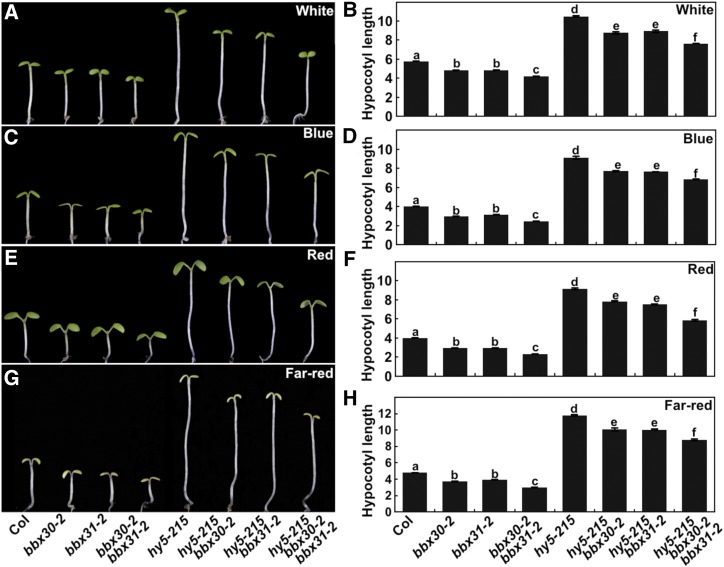
Figure 7.
Genetic interaction between BBX30, BBX31, and HY5. Hypocotyl length and phenotype of 4-d-old Col, bbx30-2, bbx31-2, bbx30-2 bbx31-2, hy5-215, hy5-215 bbx30-2, hy5-215 bbx31-2, and hy5-215 bbx30-2 bbx31-2 seedlings grown in W (33.3 μmol/m2/s; A and B), B (3.28 μmol/m2/s; C and D), R (75.1 μmol/m2/s; E and F), and FR (2.05 μmol/m2/s; G and H) conditions. Hypocotyl length is expressed in mm. Data are means ± se; n ≥ 20. Letters above the bars indicate significant differences (P < 0.05) as determined by one-way ANOVA with Tukey’s post-hoc analysis. The experiments were performed three times with similar results. The graphs depict one of three experiments.

