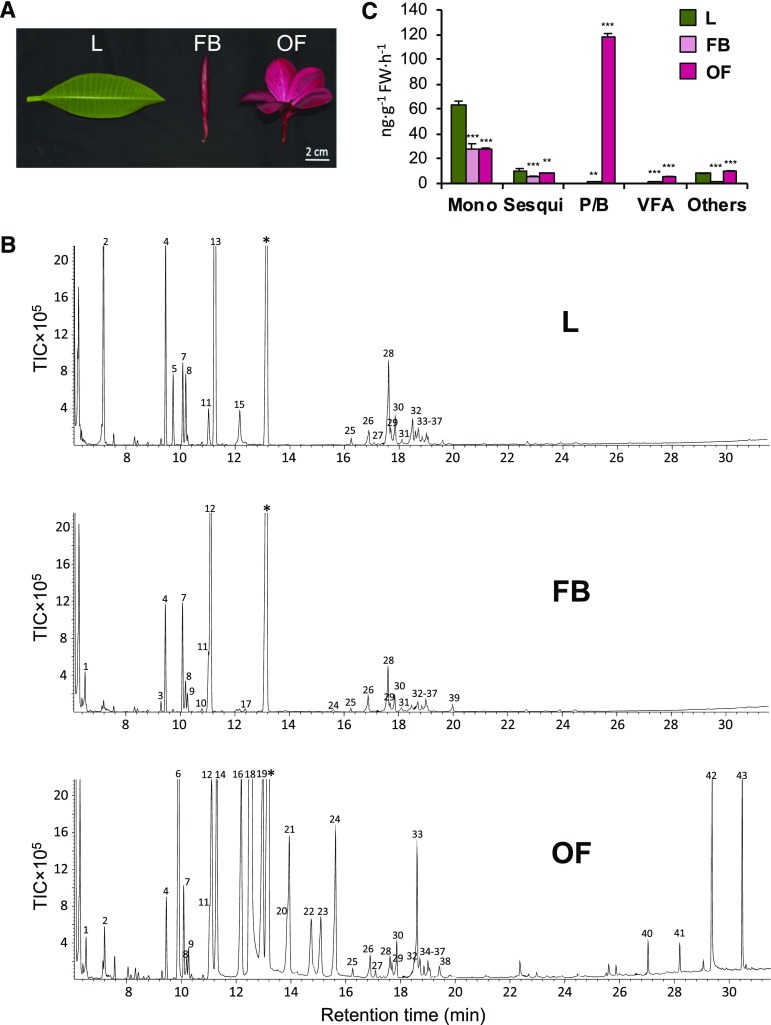
Figure 1.
VOCs composition of plumeria tissues. A, Photograph of plumeria leaf (L), floral bud (FB), and open flower (OF). Bar = 2 cm. B, Gas chromatograms showing qualitative and quantitative differential VOC emissions by plumeria tissues. The peak numbers correspond to the compounds mentioned in Table 1. Asterisks denote the internal standard camphor. TIC, Total ion chromatogram. C, Classification of VOCs emitted by plumeria tissues. Mono, Monoterpenoids; Sesqui, sesquiterpenoids; P/B, phenylpropanoids/benzenoids; VFA, volatile fatty acids; FW, fresh weight. Means and se are shown (n = 3). Student’s t test was used to calculate the significant differences of floral buds and open flowers as compared with the leaves: **, P < 0.01 and ***, P < 0.001.

