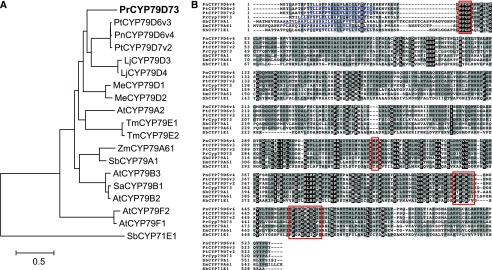
Figure 4.
Amino acid sequence analysis of PrCYP79D73. A, Phylogenetic analysis of PrCYP79D73 and CYP79 enzymes from other plant species. The maximum likelihood tree was obtained using MEGA 6.0. CYP71E1 from sorghum (Sorghum bicolor) was chosen as an outgroup. The accession numbers of all the proteins shown in this tree are given in Supplemental Table S3. B, Alignment of amino acid sequences of PrCYP79D73 and CYP79 enzymes from other plant species using ClustalW. Amino acid sequences identical in all sequences are shown in white with black background. Residues with similar side chains are shown in black with dark gray background. Sequence motifs typical for CYP79 proteins are boxed in red. The predicted N-terminal signal sequences for endoplasmic reticulum (ER) transmembrane anchoring are underlined in blue.

