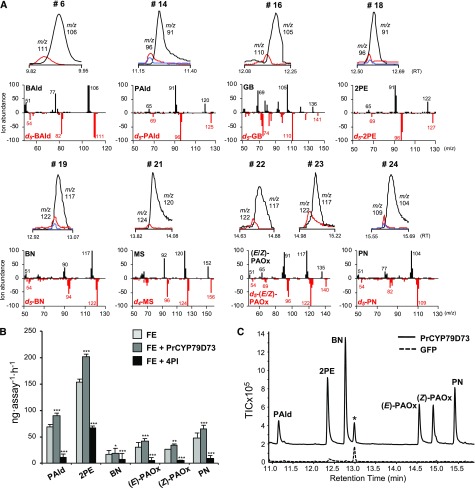
Figure 7.
In vivo characterization of PrCYP79D73. A, Peak analysis of VOCs emanated from plumeria flowers incubated with d5-l-Phe or d5-(E/Z)-PAOx overnight to assess d-labeled isomer content. The peak numbers in the gas chromatograms correspond to the compounds mentioned in Table 1. Black lines, Natural compound; red lines, d-labeled isomer produced upon incubation with d5-l-Phe; blue lines, d-labeled isomer produced upon incubation with d5-(E/Z)-PAOx. A head-to-tail comparison of mass spectra of the natural compounds (top) and their d-labeled isomers (bottom) is shown below each peak. BAld, Benzaldehyde; GB, geranyl benzoate; MS, methyl salicylate; m/z, mass-to-charge ratio; RT, retention time (min). B, GC/Q-TOF analysis of reaction products obtained by incubation of crude enzyme extracts from plumeria flowers with l-Phe (FE), crude enzyme extracts with PrCYP79D73-enriched microsomes and l-Phe (FE+PrCYP79D73), and crude enzyme extracts pretreated with 10 μm 4PI and l-Phe (FE+4PI). Results represent means ± se of two technical repetitions and three biological replicates. Student’s t test was used to calculate the significant differences of FE+PrCYP79D73 and FE+4PI as compared with FE: *, P < 0.05; **, P < 0.01; and ***, P < 0.001. C, Volatile emission of N. benthamiana plants transiently overexpressing PrCYP79D73. Plants were infiltrated with A. tumefaciens containing 35S:GFP (control) or 35S:PrCYP79D73. Volatiles were collected using the push-pull headspace method and analyzed by GC-MS. The asterisk denotes the internal standard camphor. TIC, Total ion chromatogram.

