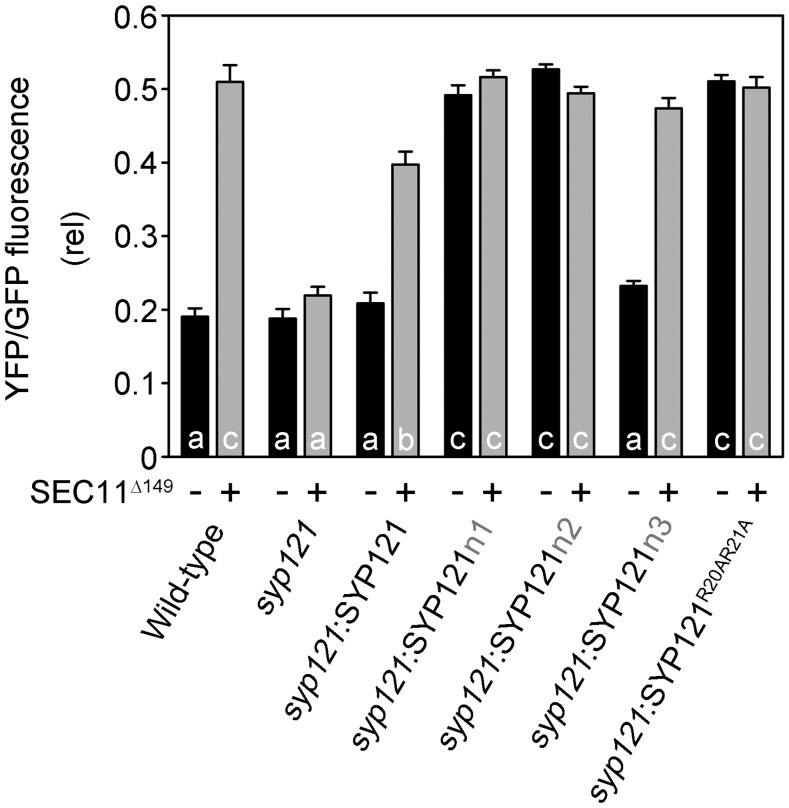
Figure 7.
Analysis of SYP121R20AR21A secretory block. Secretory traffic was calculated as YFP-GFP fluorescence ratios from three independent experiments (high YFP-GFP ratio indicates secretory block). Each bar represents the mean ± se of fluorescence intensity ratios of 10 images per experiment, taken at random over the root surface. Significant differences (P < 0.05) are indicated by different letters.

