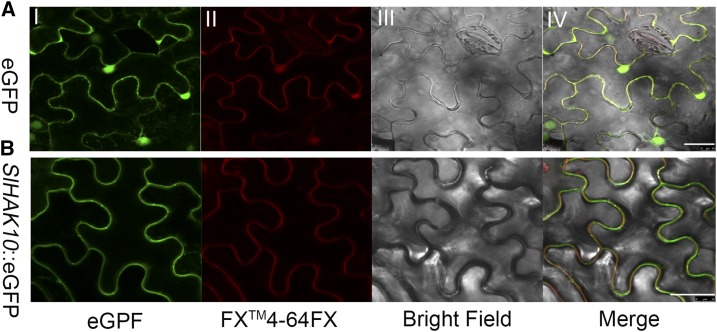
Figure 3.
Subcellular localization analysis of SlHAK10. Confocal laser scanning microscopy images show tobacco leaf epidermal cells transiently expressing 35S::eGFP (A) or 35S::SlHAK10-GFP (B). I, Confocal images under GFP channel only. II, FM4-64FX dye-induced red fluorescence showing the position of the plasma membrane. III, Bright field. IV, Merged images of GFP fluorescence (green) and FM4-64FX fluorescence (red). Bars = 50 μm.

