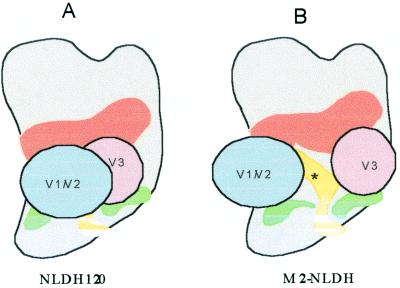
Figure 6.
A model of DH012 V1/V2 and V3 interaction. The relative location of each domain, the CD4 binding site (orange), CD4-induced epitopes (green), bridging sheet (yellow), V1/V2 (blue), and V3 (pink), was shown in the models for NLDH120 and M2-NLDH. * in B indicates a single amino acid mutation in the bridging sheet, either T198P or N197K.

