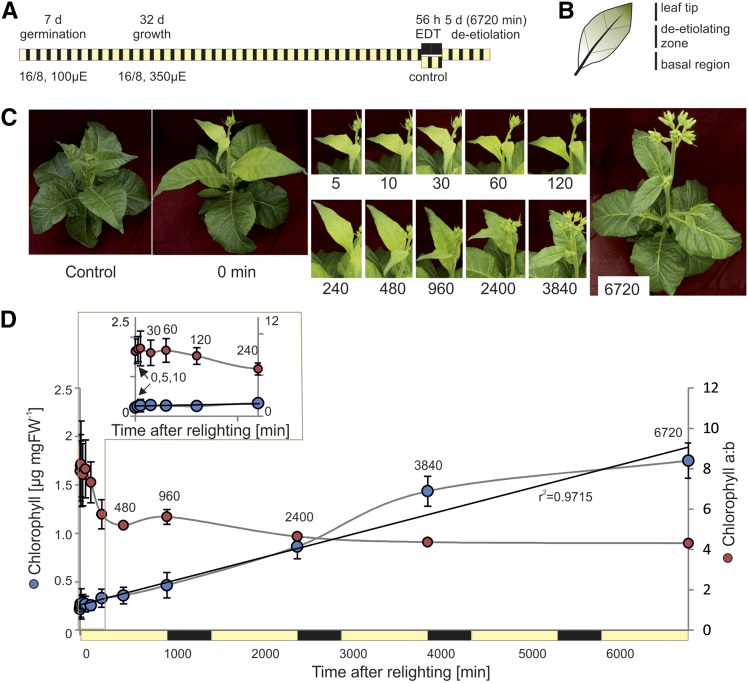
Figure 1.
A system to observe deetiolation in leaves of tobacco. A, Experimental design. Following extended dark treatment (EDT) of nearly mature tobacco plants, the dark-grown leaf sectors of young leaves were sampled across 5 d (6,720 min) of deetiolation, with particular focus on early time points. B, The measured leaf sector (deetiolating zone) was separated from the leaf tip (grown in part prior to EDT) and the basal region (newly growing tissue) following rapid freezing in liquid nitrogen. Only the deetiolating zone was used for subsequent analyses. C, Visual phenotypes of young leaves immediately following the dark treatment (0 min) and throughout the greening time course. The control plant was kept under standard growth conditions and harvested at t = 0. Numbers under the images represent time after lighting in minutes. D, Total chlorophyll content and chlorophyll a/b ratio in etiolated and deetiolating samples. Error bars indicate sd (n = 3). The black line indicates a linear trend, fitted to changing chlorophyll content, with the r2 value of the regression shown. The first 240 min are shown as an inset. Time points 960, 2,400, 3,840, and 6,720 min correspond with the end of the photoperiod on days 1, 2, 3, and 5 after lighting, respectively. FW, Fresh weight.

