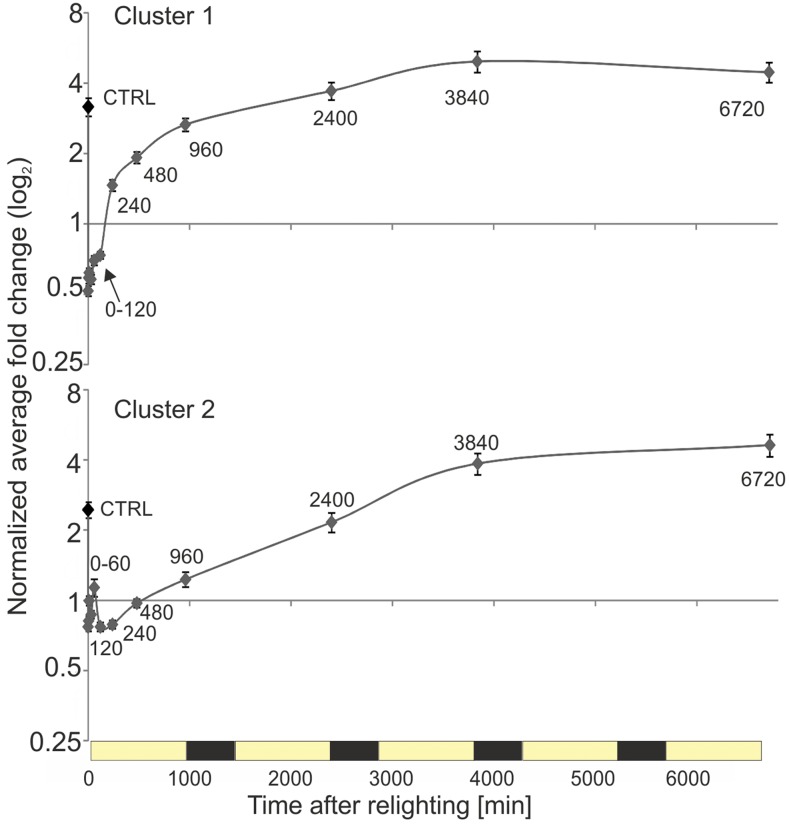
Figure 10.
Average accumulation kinetics for lipids belonging to clusters 1 and 2. Normalized average fold changes for all apparent species belonging to clusters 1 and 2 are shown. Values are shown with associated se. Cluster assignment is based on hierarchical clustering (Pearson, average linkage; Fig. 9). On average, members of both clusters showed limited variation within the first 120 min of lighting. Cluster 1 species increased primarily between 120 and 240 min and then generally continued to increase, although at a progressively decreasing rate, until the end of day 3 (3,840 min). By contrast, cluster 2 species increased rapidly between 120 and 3,840 min. Both clusters contained a diverse mix of lipids representing different classes, carbon chain lengths, and degrees of saturation (compare with Fig. 9).

