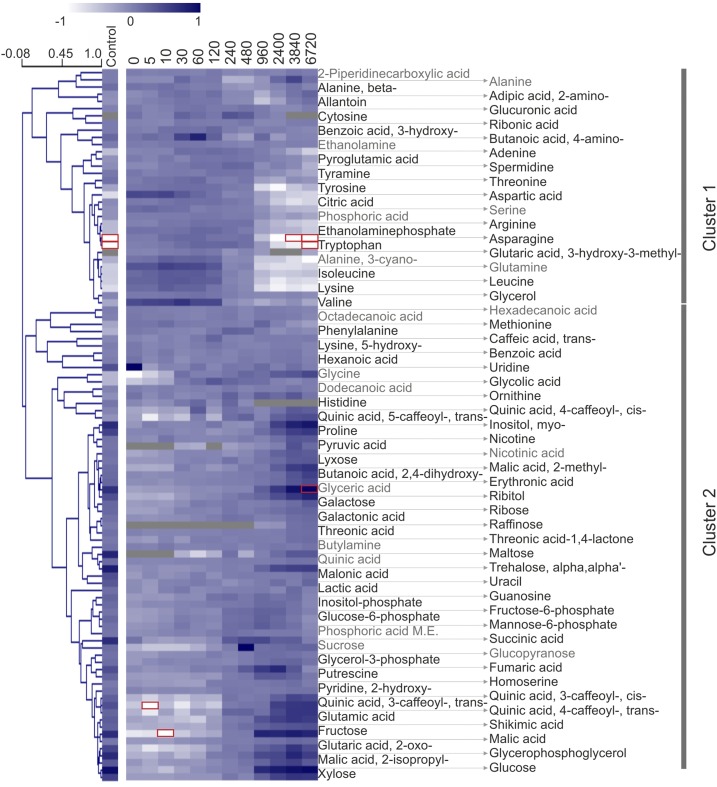
Figure 11.
Accumulation of soluble metabolites with greening. Soluble metabolites were quantified by gas chromatography-tandem mass spectrometry (GC-MS) with normalization to fresh weight and the internal standard, [13C6]sorbitol, and are represented as a median-normalized averages of three biological repeats. Phosphoric acid M.E. indicates phosphoric acid monomethyl ester. Hierarchical clustering revealed separation of amino acids from products and intermediates of central metabolism. The former group largely decreased (cluster 1) while the latter group largely increased (cluster 2) with greening. The average accumulation profiles of the identified clusters (1 and 2) are shown in Figure 12. Species found also in blank samples are shown in gray (see “Materials and Methods”), and values higher than 1 or lower than −1 (outside of the color range limits) are boxed in red. See Figure 6 for heat map and clustering details.

