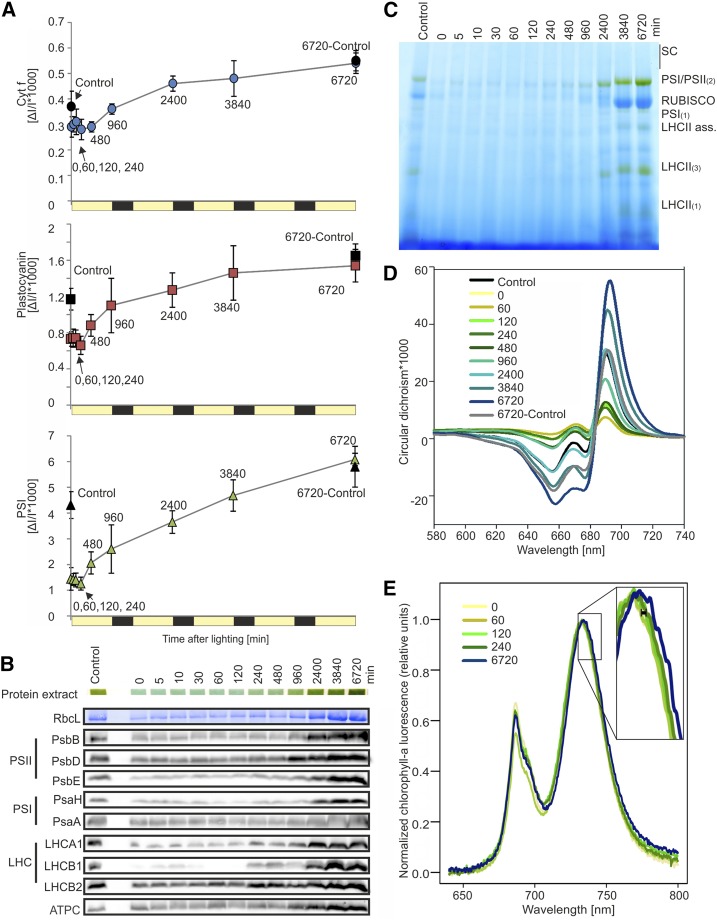
Figure 4.
Accumulation of photosynthetic proteins and complexes. A, Accumulation of cyt b6f, PCy, and PSI as measured in vivo by difference absorbance spectroscopy. PSI is quantified from the difference transmission signal of P700, and cyt f is used as a proxy for redox-active cyt b6f. Time points 5, 10, and 30 min were excluded for technical reasons (duration of the measurements). Control plants, which did not undergo extended dark treatment, were measured at both t = 0 (Control) and at the end of the time course (6720-Control). For all three components, minimal changes were seen in the first 240 min, with a large change in rate of accumulation noted before the end of the first day (240–960 min). Subsequently, PSI abundance increased quasilinearly (r2960-6720 = 0.988), while PCy and cyt f demonstrated a generally decreasing rate of accumulation with time. B, Immunoblots with antibodies against selected proteins associated with the light reactions of photosynthesis. Samples were taken from omics tissue pools and loaded on an equal fresh weight basis. RbcL shows the selected band on a Coomassie Blue-stained membrane. Protein extract shows the solubilized protein (in loading dye) within gel wells prior to running. The complete data set, including replicates and quantification, is included as Supplemental Figure S2. C, BN-PAGE. Samples were taken from omics pools and loaded on an equal fresh weight basis. SC represents supercomplexes, and numbers in parentheses indicate monomers (1), dimers (2), or trimers (3); LHCII ass. refers to LHCII assembly complexes, which have been proposed to be a solubilization-induced dissociation product of the PSII-LHCII supercomplexes (Järvi et al., 2011). PSI/PSII dimers, Rubisco, and the LHCs increase in abundance after approximately 480 to 960 min of lighting and continue to increase throughout the time course. D, CD spectroscopy, measured by equal leaf surface area. The control plant, which did not undergo extended dark treatment, was also measured at the end of the time course (6720-Control). The amplitude of the (+)690-nm band, representative of LHCII-PSII supercomplexes, and of the (−)655-nm band, linked to accumulation of LHCII timers, first increased between 60 and 120 min after lighting and continued to increase throughout the time course. Numbers in the legend represent minutes after lighting. E, Changes in the wavelength of the PSI chlorophyll a fluorescence emission peak (∼733 nm) under 77K conditions. An initial shift, indicating attachment of the LHCs to the PS core, occurred between 60 and 120 min after lighting (black bar in enlargement), with further shifts occurring throughout the time course. The complete data set is included as Supplemental Figure S3.

