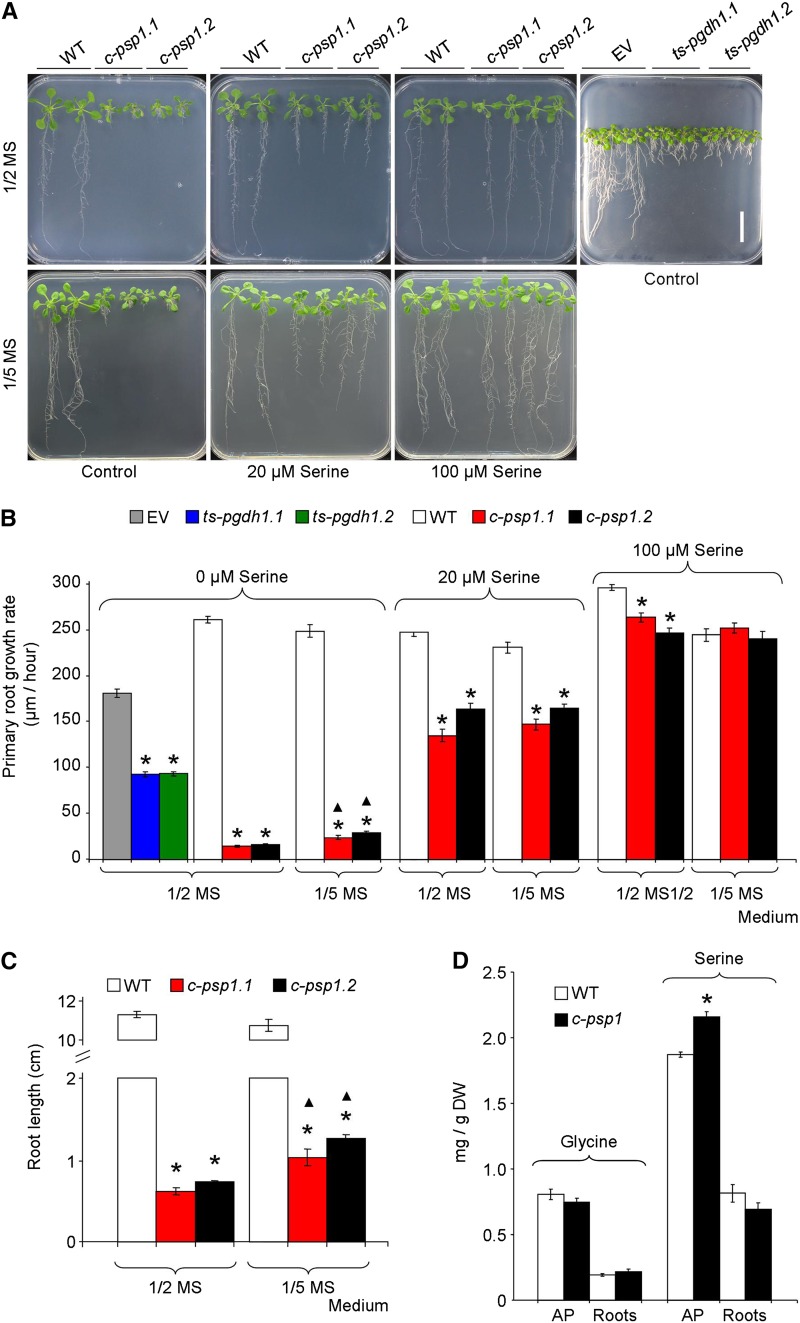
Figure 2.
Phenotype of PPSB-deficient lines in different growth media. A, Picture of c-psp1 (c-psp1.1 and c-psp1.2), ts-pgdh1 (ts-pgdh1.1 and ts-pgdh1.2), and control representative individuals grown in 1/2 MS or 1/5 MS plates supplemented with 0, 20 and 100 µM Ser. B, Primary root growth rate from seedlings grown on 1/2 MS or 1/5 MS plates supplemented with l-Ser as indicated in (A). C, Root length of 18-d-old c-psp1 grown on 1/2 MS or 1/5 MS plates. D, Gly and Ser contents in c-psp1 AP and roots. As control lines, wild-type plants (WT) or wild type transformed with the EV were used. Values represent the means ± se. In (B) and (C), n > 30 plants; in (D), n > 3 pools of 30 plants. In (D), data presented are the mean from pools of two different transgenic events. *Significantly different to control lines; ▴Significant differences between growth media (P < 0.05, Student’s t test). Scale bar = 2 cm. DW, dry weight.

