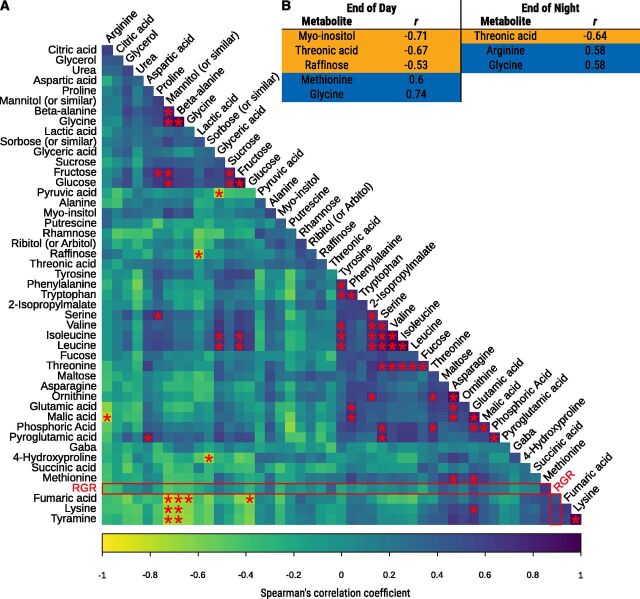
Figure 5.
Correlations between the diurnal patterns of metabolite accumulation and growth. A, Spearman correlation matrix between end of day/end of night metabolite difference. RGR comparisons are indicated by a red rectangle. Asterisks represent significant correlations (q-value < 0.05, n = 16 strains). B, Metabolites significantly correlated with RGR at the end of day and end of night. Blue and orange indicate positive and negative correlations, respectively.

