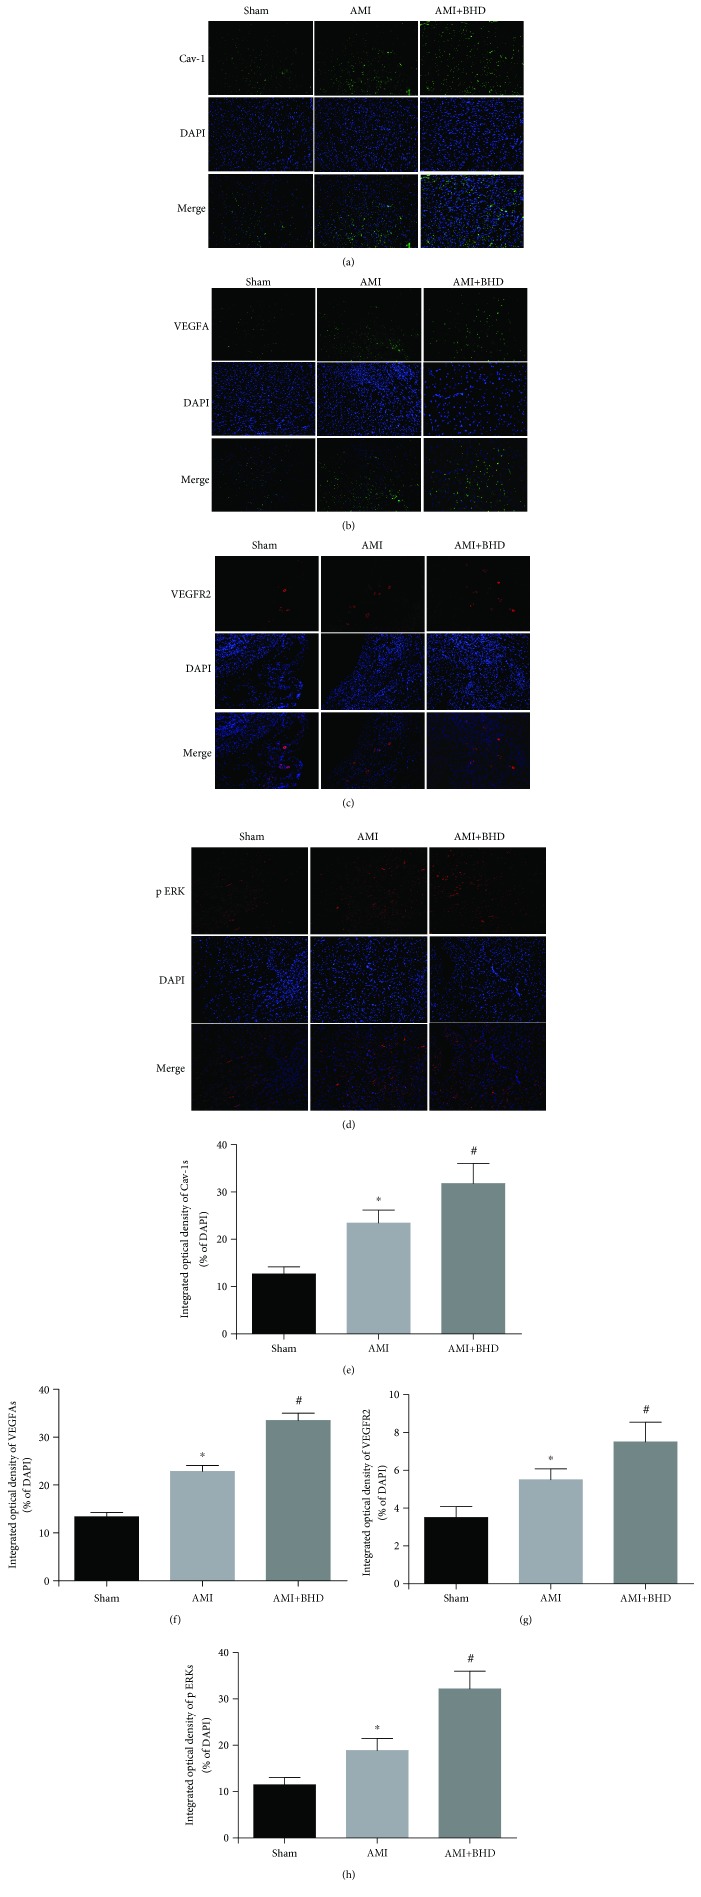
Figure 7.
Immunofluorescence staining of Cav-1, VEGF, VEGFR2, and p-ERK1/2 in the infarction border zone at 14 days after AMI in mice (mean ± SD; sham: n = 4, AMI: n = 4, and BHD+AMI: n = 6). (a) Immunofluorescence staining of Cav-1. (b) Immunofluorescence staining of VEGF. (c) Immunofluorescence staining of VEGFR2. (d) Immunofluorescence staining of p-ERK1/2. (e) Quantitative analysis of Cav-1. (f) Quantitative analysis of VEGF. (g) Quantitative analysis of VEGFR2. (h) Quantitative analysis of p-ERK1/2. ∗P < 0.05, compared with the sham group; #P < 0.05, compared with the AMI group.

