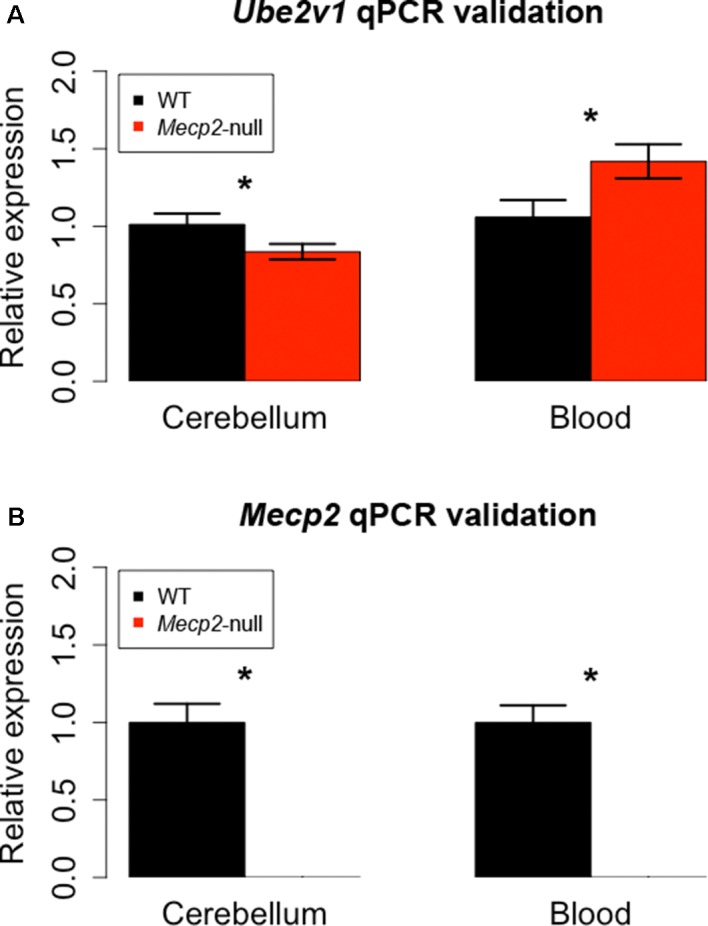
Figure 3.

qPCR on different biological samples validate Ube2v1 and Mecp2 dysregulation in brain and blood. Validation by qPCR of Ube2v1 (A) and Mecp2 (B) differential expression between Mecp2-null (N = 6) and WT mice (N = 6). Expression is represented as relative expression, calculated as 2ddCt. Regarding Ube2v1, the ddCt between Mecp2-null and WT is 0.46 in blood (p-value = 0.012, FC = 1.42) and −0.27 in cerebellum ( p-value = 0.032, FC = 0.84). In Mecp2-null mice, no Mecp2 expression was detected.
