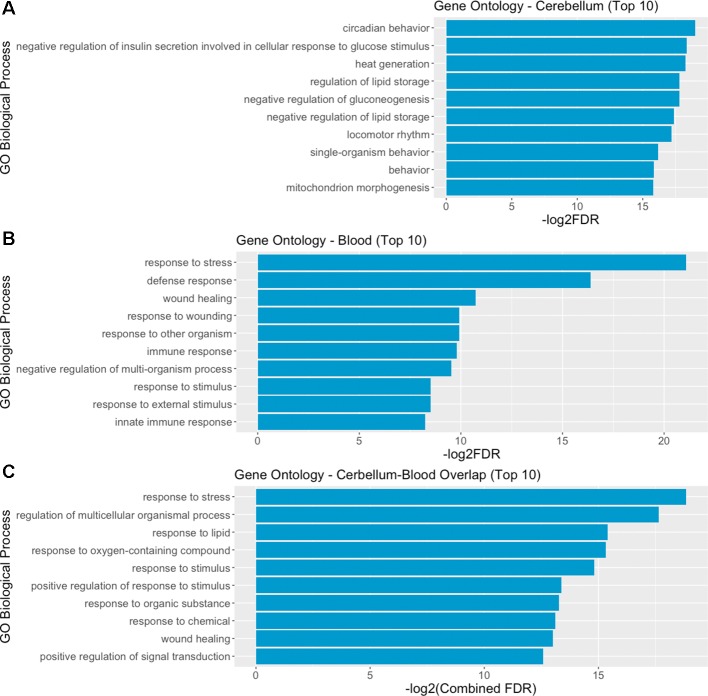
Figure 5.
Gene ontology (GO) analysis reveals overlapping biological mechanisms in cerebellum and blood. (A, B) Top 10 gene ontology biological process categories enriched in cerebellum and blood DE genes and their interactors predicted by STRING. (C) Top 10 gene ontology biological processes overlapping between blood and brain, according to their combined FDR. Combined FDR was computed as follows: FDRCerebellum + FDRBlood − FDRCerebellum * FDRBlood.

