
Figure 1.
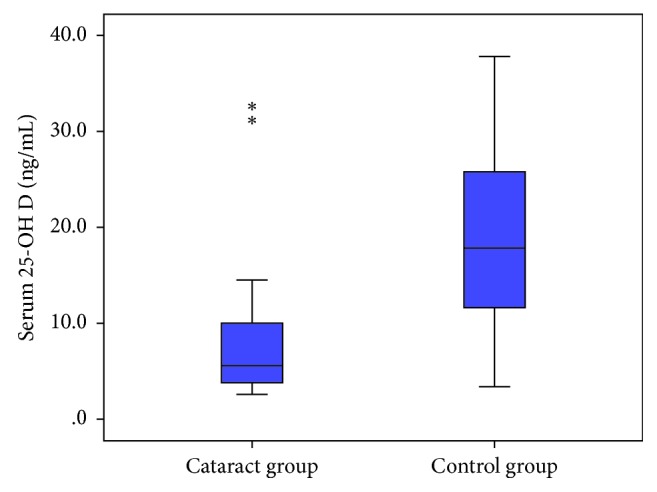
Box plot comparison of the serum 25-OH D (ng/mL) level in cases and control groups (N=710). ∗Outliers.
Official websites use .gov
A
.gov website belongs to an official
government organization in the United States.
Secure .gov websites use HTTPS
A lock (
) or https:// means you've safely
connected to the .gov website. Share sensitive
information only on official, secure websites.
Box plot comparison of the serum 25-OH D (ng/mL) level in cases and control groups (N=710). ∗Outliers.