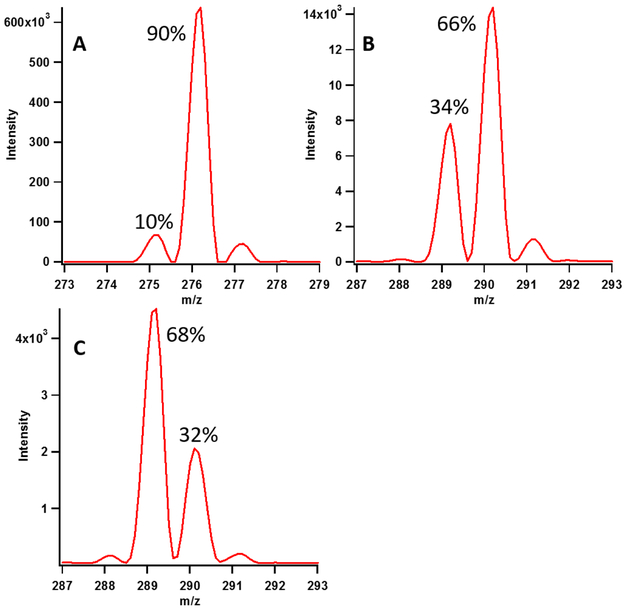
Figure 5:
Representative isotopic distribution of substrate adenosine (A) and m8A (B and C) from assays performed with deu155mer (B) and deu16mer (C) after 120 minutes. Panel B shows the majority peak at m/z 290, which is consistent with the C8 deuteron being returned to the methyl group. Panel C shows that the majority species is m/z 289, which is consistent with the C8 deuteron not being returned to the methylated product. Isotopic abundance variation for assays performed with deuRNA substrates is presented in Table S3.

