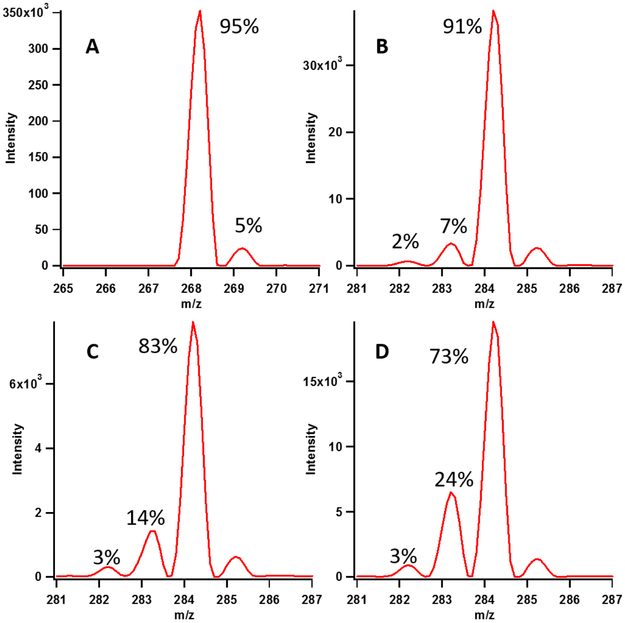
Figure 6:
Representative isotopic distribution of substrate adenosine (A) and product m8A (B-D) from assays performed with [methyl-d3]-SAM, apo Cfrwt→rcn, and 155mer (B), 16mer (C) and 7mer (D) after 120 minutes. In all product spectra the majority species is d2-containing m8A (m/z 284) with smaller amounts of d1 and d0-containing products. Additionally, with decreasing substrate size, greater loss of deuterium is observed. Isotopic abundance variation for assays performed with [methyl-d3]-SAM is presented in Table S4.

