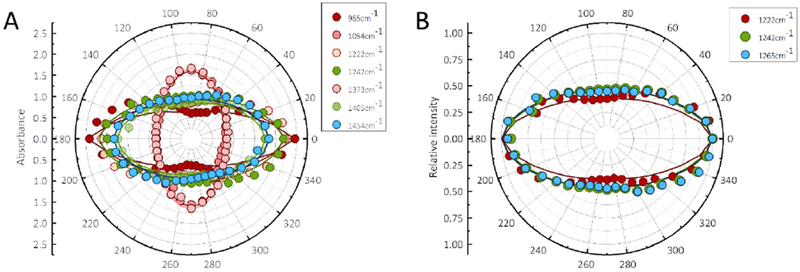
Figure 2. Infrared dichroism of single A. yamamai silk fibers.

A, Polar plot of the absorbance of the characteristic peaks in SFTIR microspectra in the 1500-800 cm−1 region from single A. yamamai silk fibers. The symbols represent individual experimental data points, while the curves are fitted using Equation 1. The peaks atl454 to 1405 cm−1 are not sensitive to the conformation change. The peak at 1242 cm−1 is attributed to random coil, while the peaks at 1373, 1222, 1054 and 965 cm−1 are assigned to β-sheet. In these β-sheet peaks, 1222 and 965 cm−1 have parallel dichroism, while 1373 and 1054 cm−1 have perpendicular dichroism. B, Polar plot of the relative intensity of different component from the deconvolution of amide III band in S-FTIR microspectra of single A. yamamai silk fibers. The peaks at 1222, 1242, and 1265 cm−1 in amide III band are assigned to β-sheet, random coil and α-helix, respectively. More details of the assignments of these peaks can be found in ref (38).
