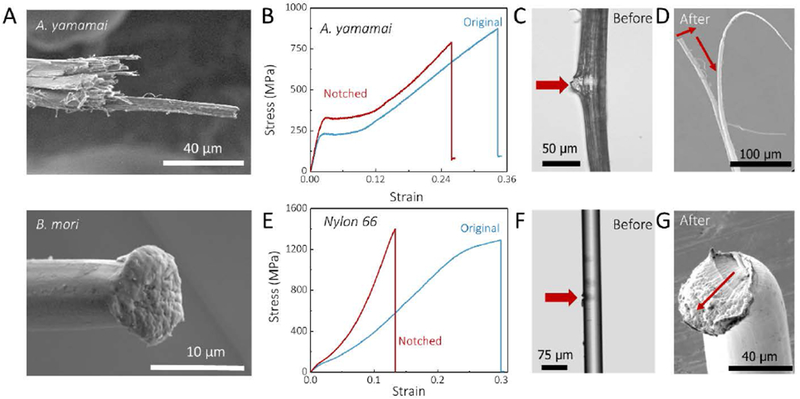
Figure 4. Comparison of mechanical performance between A. yamamai silk and Nylon 66 fiber.

A, SEM images of tensile fracture morphologies of A. yamamai silk and B. mori silk. B, Stress-strain curve of original and notched A. yamamai silk fiber. C and D, The microphotograph of notched A. yamamai silk fiber before (C, optical microscopy image) and after (D, SEM image) the tensile fracture. E, Stress-strain curve of original and notched Nylon 66 fiber. F and G, The microphotograph of notched Nylon 66 fiber before (F, optical microscopy image) and after (G, SEM image) the tensile fracture. The red arrows in C and F indicates the notch of the fibers. These images confirmed the notched width was smaller than the half width of the fiber using in testing. The red arrows in D and G displays the crack propagation direction after tensile failure.
