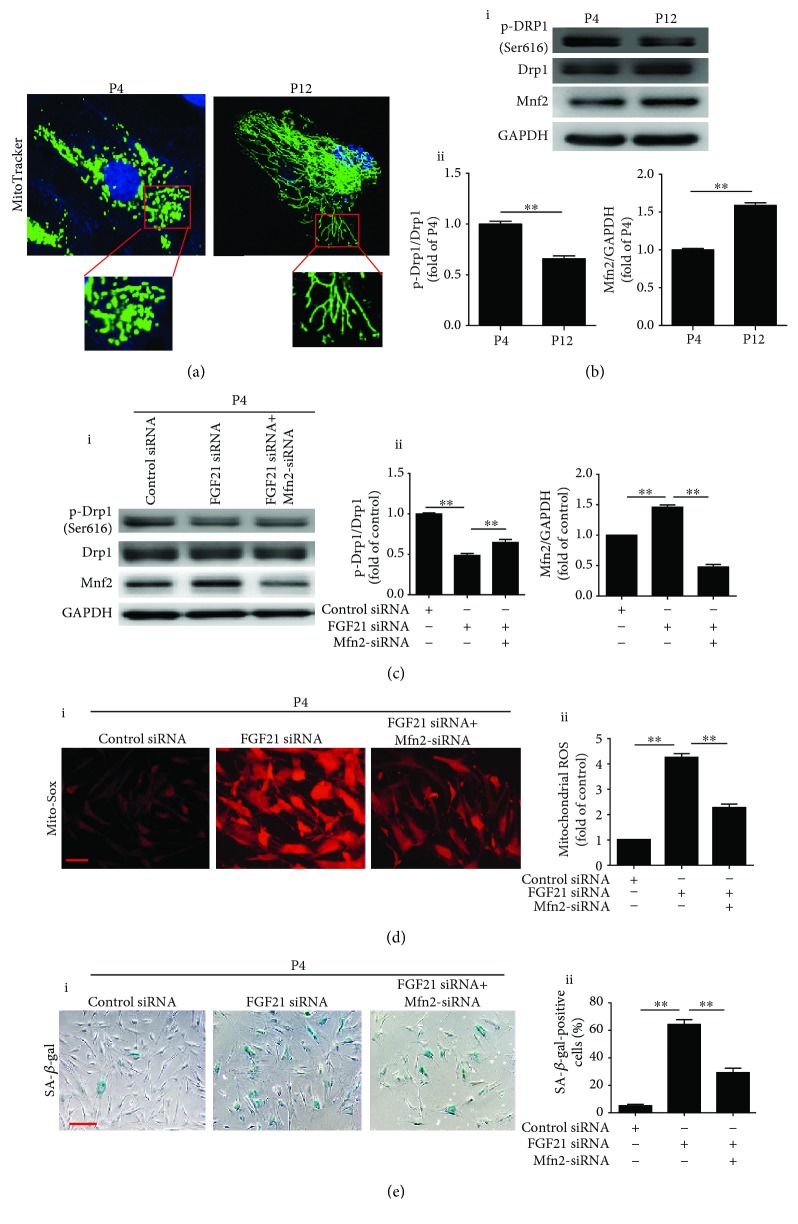
Figure 4.
Silencing FGF21 induces ROS generation via regulation of mitochondrial dynamics. (a) Representative images of MitoTracker staining in BM-MSCs at P4 and P12. (b) Western blotting and quantitative analysis of the levels of p-Drp1/Drp1 and Mfn2 proteins in BM-MSCs at P4 and P12 (i, ii). (c) Western blotting and quantitative analysis of the level of p-Drp1/Drp1 and Mfn2 proteins in control siRNA or FGF21 siRNA or FGF21 siRNA+Mfn2 siRNA-treated BM-MSCs at P4 (i, ii). (d) Representative images of Mito-Sox staining in BM-MSCs at P4 from the control siRNA or FGF21 siRNA or FGF21 siRNA+Mfn2 siRNA-treated group (i). Quantitative analysis of the ROS generation in control siRNA or FGF21 siRNA or FGF21 siRNA+Mfn2 siRNA-treated BM-MSCs at P4 (ii). (e) Representative images of SA-β-gal staining in BM-MSCs at P4 from the control siRNA or FGF21 siRNA or FGF21 siRNA+Mfn2 siRNA-treated group (i). Percentage of SA-β-gal-positive senescent cells in control siRNA or FGF21 siRNA or FGF21 siRNA+Mfn2 siRNA-treated BM-MSCs at P4 (ii). Data are expressed as mean ± SEM with n = 3 per group. ∗∗ p < 0.01. Scale bar = 100 μm.

