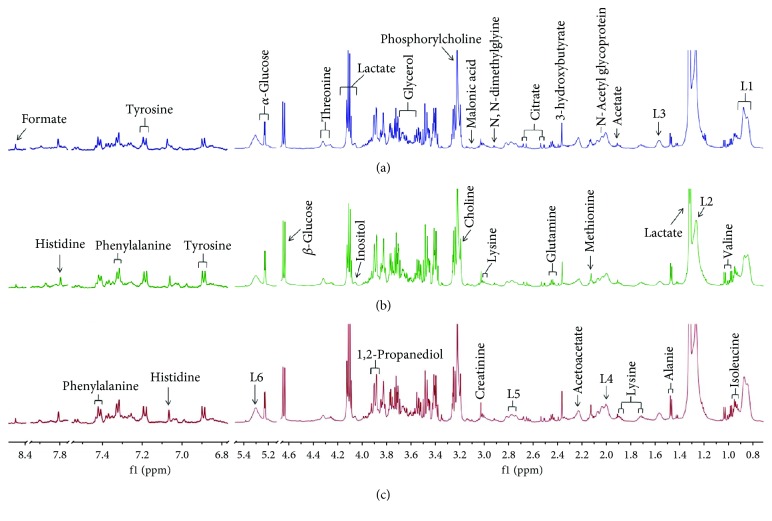
Figure 6.
Representative 1H NMR CPMG spectra of the serum samples of mice ((a) normal group, (b) SHXXD group, and (c) control group) in the range of 0.8-8.5 ppm. The low-field region (6.8-8.5 ppm) was magnified 12 times from the remaining region for the purpose of clarity. Signal assignments: (L1) LDL and VLDL, CH3–(CH2)n–; (L2) LDL and VLDL, CH3–(CH2)n–; L3 (lipids), –CH2–CH2–C=O; (L4) lipids, –CH2–CH=CH–; (L5) lipids, =CH–CH2–CH=; and (L6) lipids, –CH=CH–.

