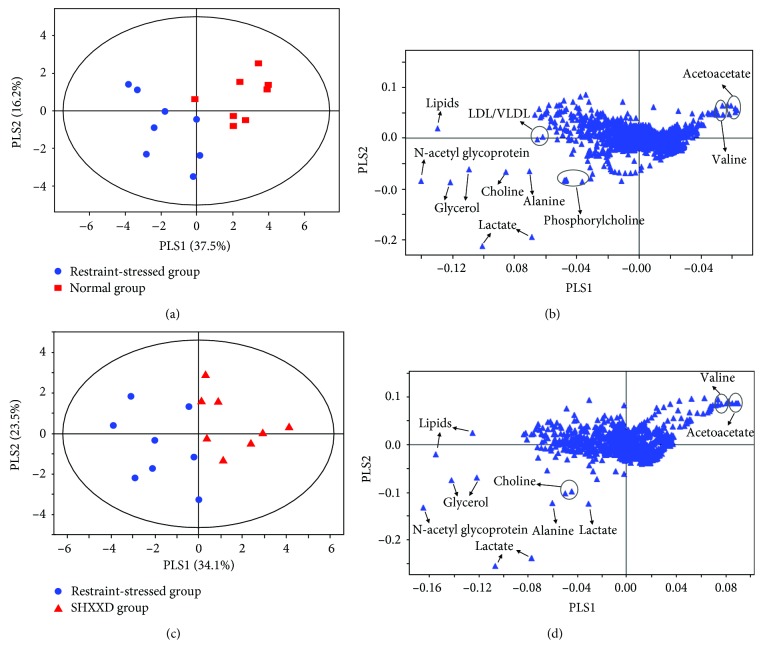
Figure 7.
Score plots and corresponding loading plots generated from pairwise PLS-DA analysis of 1H NMR data: (a) score plot of the normal and restraint-stressed groups; (b) loading plot of the normal and restraint-stressed (control) groups; (c) score plot of the restraint-stressed and SHXXD groups; (d) loading plot of the restraint-stressed and SHXXD groups.

