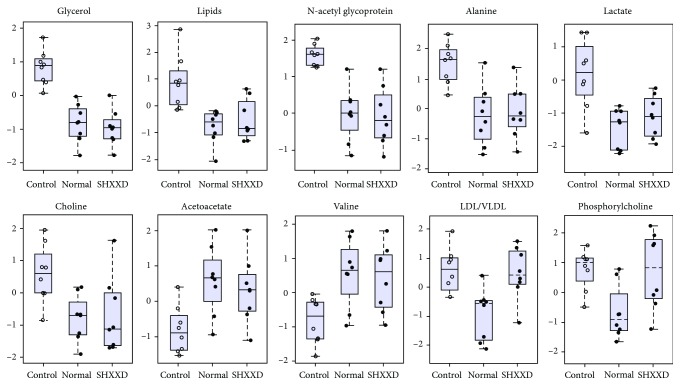
Figure 8.
Boxplot of relative levels of the 10 differential metabolites that were obtained from PLS-DA in the serum of the normal, restraint-stressed (control), and SHXXD groups of mice. Data were normalized to the total spectral area, and so the bar plots show the normalized values, and Y axes are represented as relative units.

