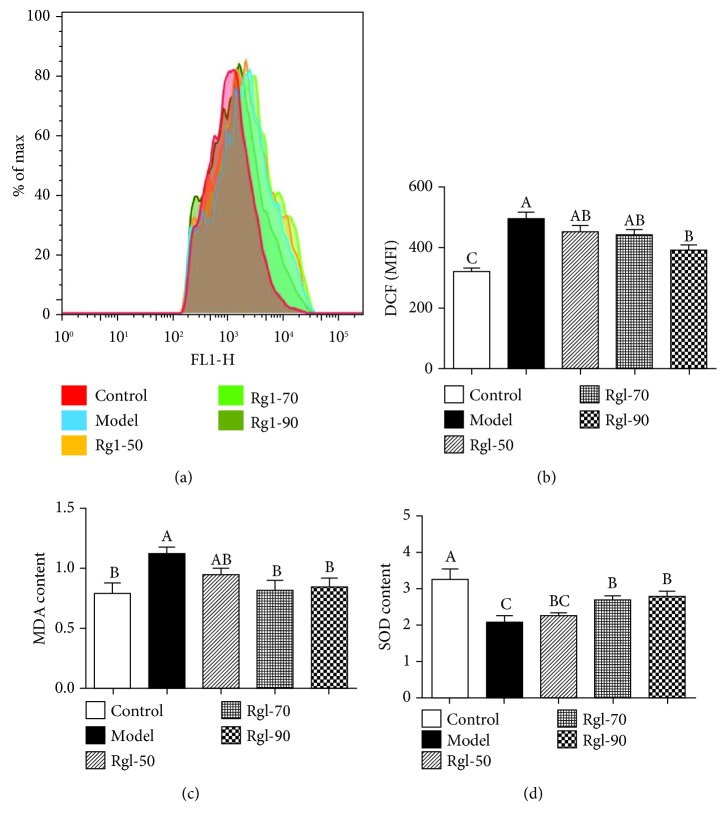
Figure 1.
Effect of Rg1 on the redox state within cells. Cells (5 × 10⁶) were treated with Rg1 (0, 50, 70, and 90 μg/mL) for 24 h first and then incubated in media with (model) or without (control) H2O2 (100 μmol/L) for an additional 4 h. The original tracings showing the (a) DCF fluorescence intensity (intracellular ROS), (b) mean fluorescence intensity (MFI), (c) MDA content, and (d) SOD activities were determined as described in the text. All data are presented as mean ± S.E. (n = 6). Bars with different letters were significantly different (P < 0.05).

