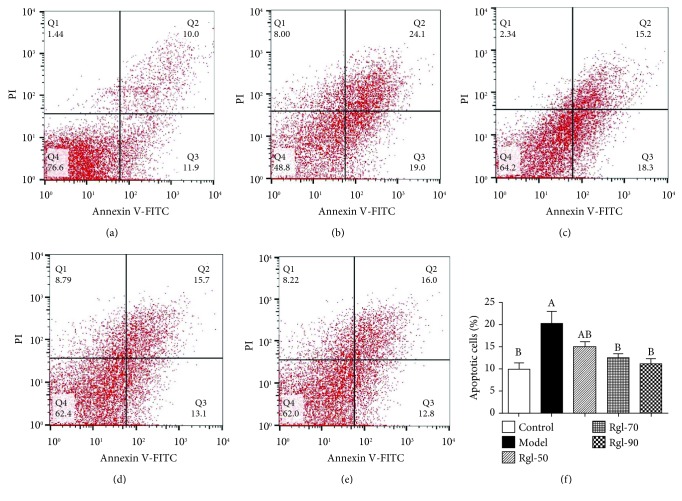
Figure 3.
Effect of Rg1 on apoptosis of cells. Cells (5 × 10⁶) were treated with Rg1 (0, 50, 70, and 90 μg/mL) for 24 h first and then incubated in media with (model) or without (control) H2O2 (100 μmol/L) for an additional 4 h. Apoptotic cells (Annexin V+/PI-) were discriminated by FCM analysis: (a) control group; (b) model group; (c) 50 μg/mL Rg1 group; (d) 70 μg/mL Rg1 group; (e) 90 μg/mL Rg1 group; (f) bar diagram representing apoptotic cell populations. All data are presented as mean ± S.E. (n = 6). Bars with different letters were significantly different (P < 0.05).

