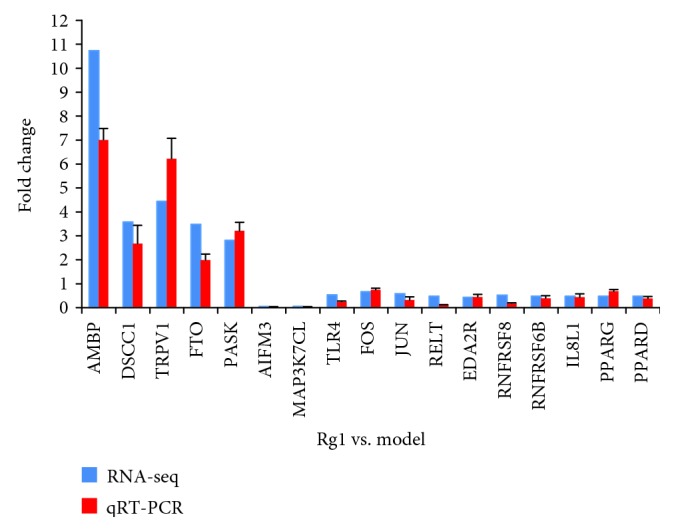
Figure 9.

Gene expression determined by RNA-seq and RT-qPCR (n = 3). RT-qPCR validation of seventeen differentially expressed genes in the comparison of Rg1 vs. the model. The data were normalized to the expression of β-actin, and the fold changes were calculated as Rg1/model.
