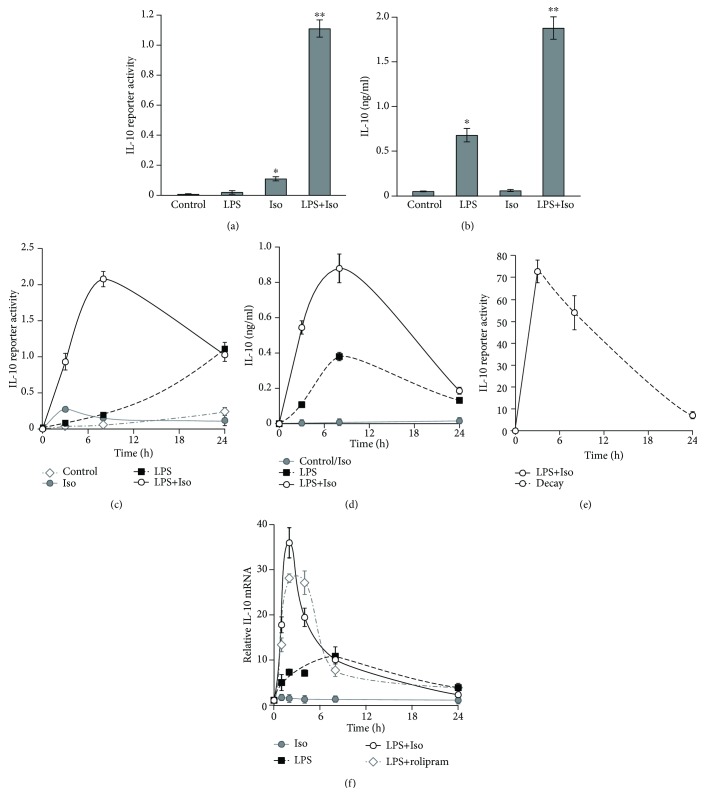
Figure 1.
The cAMP pathway synergistically stimulates early, but not late, LPS-induced IL-10 transcription. (a–d) Early synergism at the IL-10 promoter reporter and IL-10 secretion levels. RAW264.7 macrophages, transfected with a full mouse IL-10 promoter reporter construct, were incubated with LPS (10 ng/ml) and/or isoproterenol (Iso, 1 μM) for 3 h (a, b) or for up to 24 h (c, d). (b, d) The medium was collected, and the secretion of endogenous IL-10 was measured by ELISA. Data represent the mean ± SD (n = 3). (a, c) Luciferase reporter data expressed as the mean ± SD (n = 3) of values normalized against Renilla luciferase activity. (a, b) ∗ p < 0.003 and ∗∗ p < 0.0005 relative to resting cells. (c) p < 0.05 relative to resting cells for all treatments except for LPS at 3 h and Iso at 24 h. (d) Values of isoproterenol treatment were indistinguishable from control values. p < 0.05 relative to resting cells for LPS and for LPS+Iso at all time points. (c, d) p < 0.05 for LPS+Iso relative to LPS only at 3 h and 8 h. The experiments shown in (a–d) were carried out 45, 48, 14, and 12 times, respectively, with similar results. (e) Decay rate of the reporter. RAW264.7 macrophages, transfected with a full mouse IL-10 promoter reporter construct, were incubated with LPS (10 ng/ml) and isoproterenol (Iso, 1 μM) for 3 h, the stimuli-containing medium was removed, and decay of the reporter was measured at the indicated time points along the dashed line. Luciferase reporter data expressed as the mean ± SD (n = 3) of values normalized against Renilla luciferase activity, relative to unstimulated control cells. p < 0.05 relative to resting cells at all time points. The experiment was carried out twice. (f) Early synergism at the IL-10 mRNA level. RAW264.7 macrophages were stimulated with LPS (10 ng/ml) and/or isoproterenol (Iso, 1 μM) or the PDE4 inhibitor rolipram (20 μM) for the indicated time. Total RNA was isolated from the cells, and IL-10 mRNA levels were assessed by real-time PCR. The intensity of IL-10 mRNA in unstimulated cells, normalized by HPRT mRNA, was set to 1. Data represent the mean ± SD (n = 3). p < 0.05 relative to resting cells for Iso at 1 h only and for all other treatments at all time points. p < 0.05 for LPS relative to LPS+Iso or LPS+rolipram only at 1-4 h. The experiment was carried out twice.

