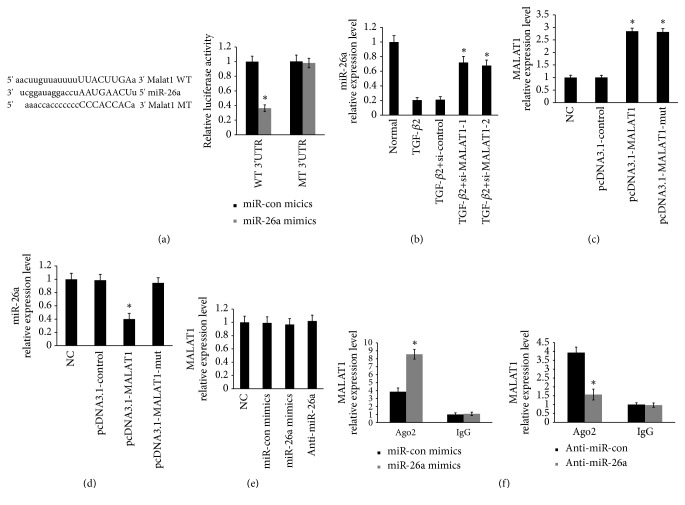
Figure 4.
MALAT1 negatively regulated the expression of miR-26a. (a) The luciferase reporter assays identified that MALAT1 contains a binding site for miR-26a in HLECs. ∗P < 0.05 compared with miR-26a mimics control group. (b) The levels of miR-26a were detected by qRT-PCR. ∗P < 0.05 compared with TGF-β2 group. (c) The levels of MALAT1 were detected by qRT-PCR. ∗P < 0.05 compared with pcDNA3.1-control group. (d) The levels of miR-26a were detected by qRT-PCR. ∗P < 0.05 compared with pcDNA3.1-control group or pcDNA3.1-MALAT1-mut group. (e) The levels of MALAT1 were detected by qRT-PCR. (f) The levels of MALAT1 were detected by qRT-PCR. ∗P < 0.05 compared with miR-26a control group. All of data are presented as the mean± SE of six independent experiments.

