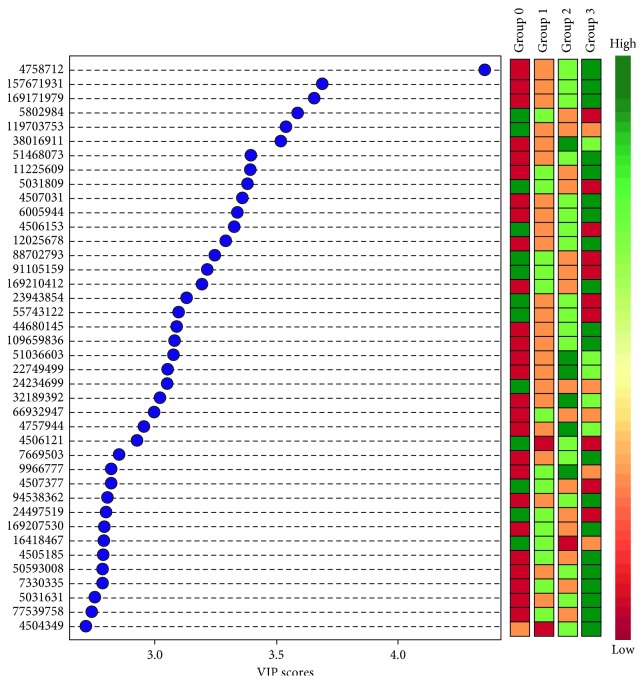
Figure 3.
Variable importance in projection (VIP) plot: important features (analyzed NSAF scores of the proteins) identified by PLS-DA in a descending order of importance. The graph represents relative contribution of proteins to the variance between the cirrhotic subject and noncirrhotic subject control urine exosomes. High value of the VIP score indicates great contribution of the proteins to the group separation. The green and red boxes on the right indicate whether the protein concentration is increased (green) or decreased (red) in the exosome of the cirrhotic subject urine vs. noncirrhotic subject urine samples.

