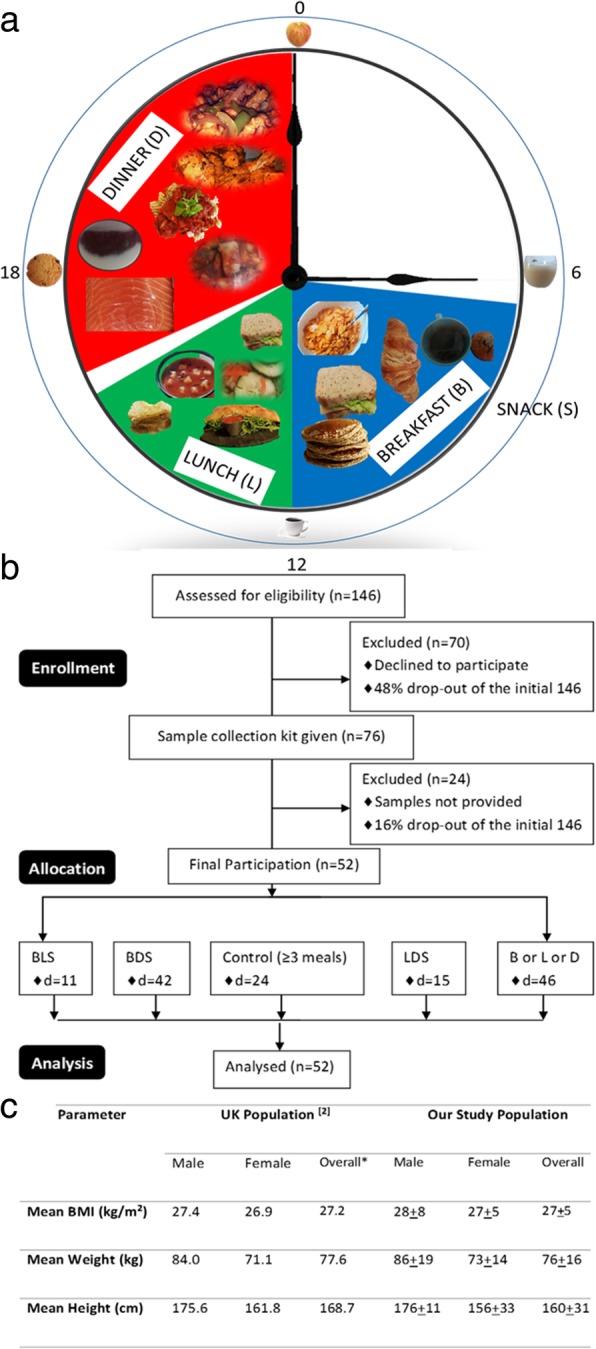
Fig. 1.

Study Design. a Meal plan layout for the participants in a 24 h period. b Flow diagram of the study design. c Comparison between demographic features of the study participants and the UK population. Overall numbers for the UK population was the arithmetic middle between the male and female values based on the assumption that the distribution of male and females in the statistics was approximately 50%. In this study, there was more females than males, so the overall number was obtained directly from the raw data
