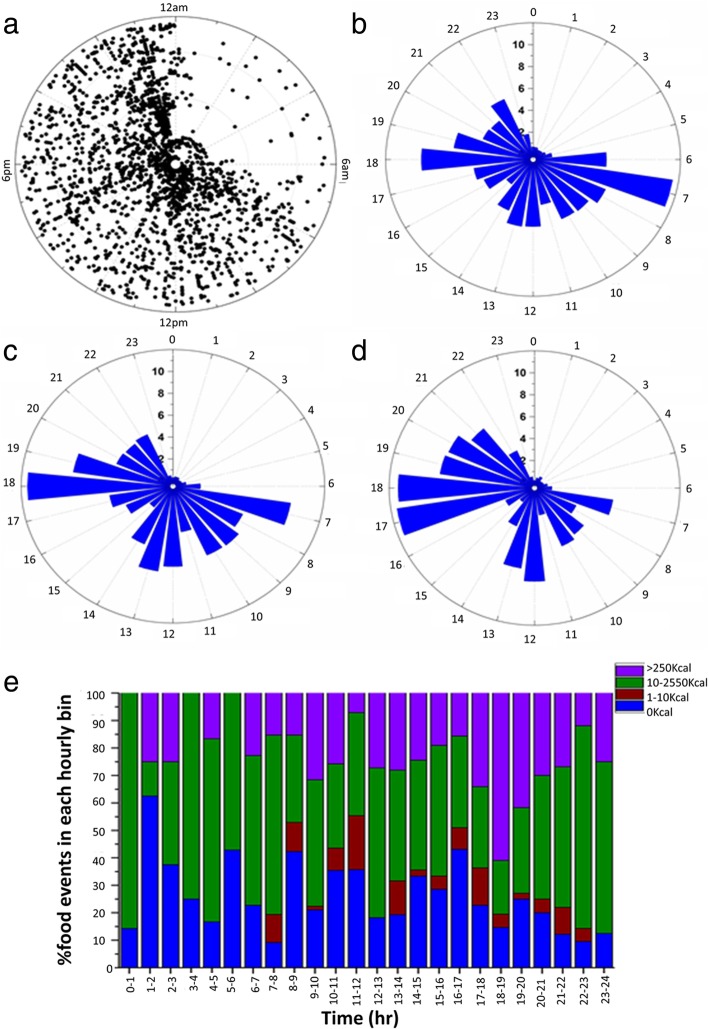
Fig. 2.
More calories are consumed at dinner and breakfast and dinner combination were more popular than breakfast and lunch. a Polar plot of all entries of each individual plotted against the time of day (angular axis). Data from 52 individuals are shown. 24 h rose plots showing (b) percentage of total entries from individuals, (c) percentage of ingestion events and (d) % of calories consumed. e Percentage of food events in 1 h bins. The radial axis for each rose plot shows % of events

