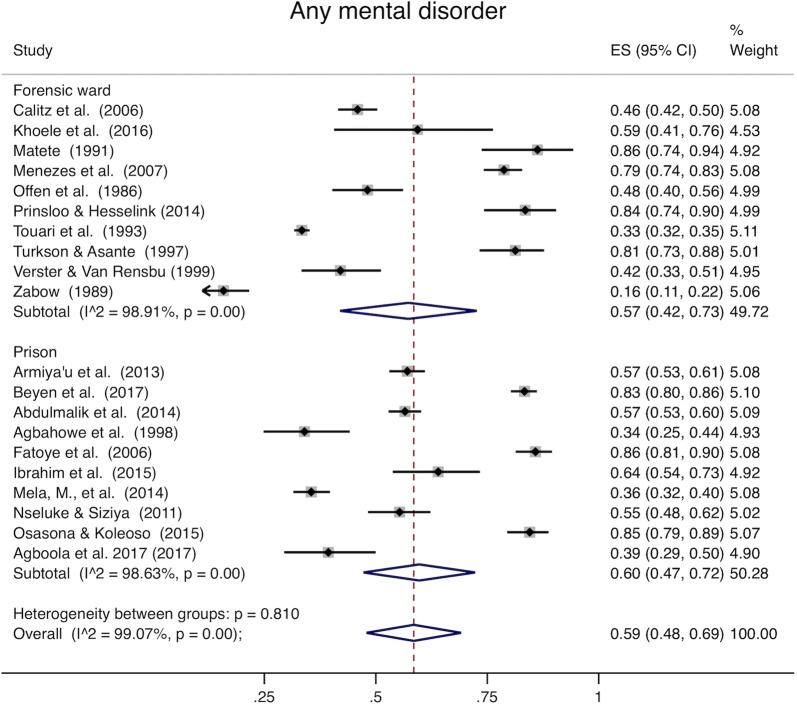
Fig. 2.
Mental ill health. The x-axis in each plot displays prevalence (0–1). The far right column displays the prevalence within each study, pooled prevalence for each subgroup, and overall pooled prevalence with their respective weights. Armiya’u et al. [86] and Armiya’u et al. [87] describe the same study and sample and report the same prevalence. Only one point prevalence from this sample was included from these articles in Figs. 2, 3, 4, and 5

