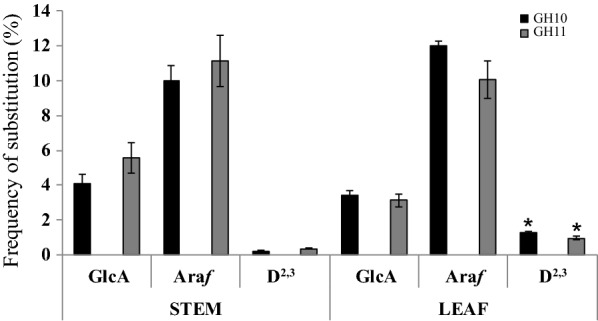
Fig. 8.

Quantification of substitution frequency of miscanthus stem and leaf GAX. All characterised GH10 and GH11 hydrolysis products were analysed by DASH using the DASHboard software for quantification. The substitution frequency was calculated after normalisation of values by comparing the abundance side chain to the Xylp residues in the backbone. Error bars represent mean ± SD (n = 3). A significant difference was observed in the D2,3 substitution frequency of the GH10 digest (p = 0.002) and of the GH11 digest (p = 0.2) between stems and leaves and between the GH10 and G11 digest in leaves only (p = 0.01) using the paired t-test for two-tailed distribution, marked with asterisk
