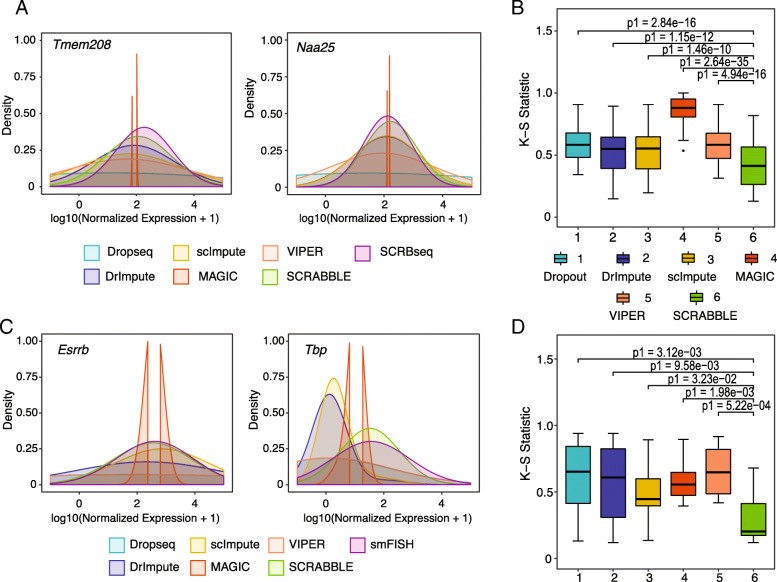
Fig. 4.
SCRABBLE-imputed gene expression distribution has a better match with gold standards. a Gene expression distributions of two representative genes in true (SCRB-Seq), dropout (Drop-Seq), and imputed data. b Boxplots of the agreement of gene expression distribution between true data (SCRB-Seq) and imputed data using Drop-Seq data as input to the methods. Agreement between the two distributions is measured using the Kolmogorov-Smirnov (KS) test statistic. A set of 56 genes in mouse ES cells is examined. c Gene expression distributions of two representative genes in smRNA FISH data and imputed data. d Boxplots of the agreement of gene expression distribution between smRNA FISH data and imputed data. P values are based on Student’s t test

